01. Quick Answer
The most defensible 2030 ASX 200 forecast is constructive, but only within a wide range
The ASX 200 price index has gained roughly 64.92% over the last 10 years, rising from 5,233.40 on 2016-05-31 to 8,630.80 on 2026-05-15 in the Yahoo Finance series (10-year history; recent daily closes). That works out to a price-only compound rate of about 5.15%, which is respectable but not explosive compared with U.S. mega-cap benchmarks. The 2030 question is therefore less about whether Australia can produce another speculative boom and more about whether the index can keep compounding while inflation, rates, and China sensitivity all remain live risks.
Available evidence supports a conditional upside bias. The official S&P Dow Jones factsheet shows an index dominated by financials and materials, with the top 10 constituents carrying 48.6% of the benchmark and the largest constituent weighing 11%. That structure creates both resilience and fragility. If bank earnings, dividends, and commodity cash flow stay intact, the index can grind higher. If those pillars weaken together, the same concentration works in reverse.
| Point | Why it matters |
|---|---|
| The ASX is still an income-and-cyclicals market | The benchmark remains driven more by banks, miners, and dividends than by software-style multiple expansion. |
| Macro now matters more than it did in 2024 | ABS inflation data and the RBA both show that price pressure re-accelerated in early 2026. |
| Australia still has real structural tailwinds | Future Made in Australia and critical minerals policy matter for long-run capital expenditure and trade positioning. |
| Scenario ranges are more honest than one-number targets | Institutional sources give direction, but they do not offer a single official 2030 ASX 200 target investors can treat as certainty. |
02. Historical Context
A decade of gains hides the fact that Australia remains a concentrated and cyclical index
The 10-year Yahoo Finance series shows the ASX 200 trading between roughly 5,076.80 and 9,198.60, with the deepest monthly drawdown in that span occurring during the 2020 shock, when the benchmark fell more than 27% from its late-2019 peak to the March 2020 trough (Yahoo Finance chart API for ^AXJO, 10-year monthly history). That pattern is important because it reminds investors that Australian equities can look defensive for years and then reprice sharply when growth, commodities, or bank risk all wobble together.
Index design explains a lot of that behavior. The S&P Dow Jones Indices, S&P/ASX 200 Index (AUD) Factsheet, as of April 30, 2026 shows financials at 34.5% of the index and materials at 25.0%, meaning nearly 60% of the benchmark sits in two cyclical sectors. Commonwealth Bank, BHP, Westpac, NAB, ANZ, Macquarie, Woodside, Rio Tinto, Wesfarmers, and Goodman dominate the top 10 list. That is not a complaint; it is the core fact investors have to underwrite before making any 2030 call.
| Metric | Latest reading | Forecast relevance |
|---|---|---|
| Current index level | 8,630.80 | Anchors every scenario to the latest available close rather than a stale record high. |
| 52-week range | 8,295.10 to 9,198.60 | Shows the market is trading below the February 2026 peak but still well above the 2025 lows. |
| Distance from record high | -6.22% | The market has already corrected modestly from its February peak around 9,202.90. |
| Indicated dividend yield | 3.43% | The yield cushion helps explain why the ASX often grinds rather than collapses in normal slowdowns. |
| Feature | Implication | 2030 effect |
|---|---|---|
| High bank weight | Credit growth, capital returns, and housing quality matter heavily | Upside is steadier, but the index is exposed to policy mistakes and mortgage stress. |
| Large materials exposure | China, copper, iron ore, coal, and energy cycles still shape earnings | 2030 upside improves if resource cash flow stays firm, but downside widens in a global industrial slowdown. |
| Lower direct tech weight | The AI mania premium is limited | Valuation risk may be lower than in tech-heavy markets, but narrative upside is lower too. |
| Dividend-heavy return profile | Total return can exceed price return by a meaningful margin | Long-term investors may fare better than the headline price index alone suggests. |
03. Main Drivers
Five forces are most likely to shape the 2030 range
1. Monetary policy and inflation. The RBA's May 2026 decision and Statement on Monetary Policy make clear that inflation re-accelerated and that markets were pricing the cash rate around 4.70% by the end of 2026 (policy decision; May SMP). Meanwhile, the ABS reported annual CPI at 4.6% in March 2026 and trimmed mean inflation at 3.3% (Australian Bureau of Statistics, Consumer Price Index, Australia, March 2026). If that stickiness persists, valuation expansion becomes much harder.
2. The labor market and domestic demand. Australia still entered spring 2026 with a relatively tight labor market. The ABS put March unemployment at 4.3%, participation at 66.8%, and employment still rising (Australian Bureau of Statistics, Labour Force, Australia, March 2026). That supports household income, but it also keeps wages and services inflation from falling quickly.
3. China and resource demand. ANZ and Westpac both frame Australia as a market whose earnings outlook remains deeply linked to commodity prices and Asian demand (ANZ on China decarbonisation; Westpac on commodities). The evidence is mixed because decarbonisation is positive for copper and critical minerals but less supportive for some legacy bulk commodities.
4. Fiscal and industrial policy. The 2026-27 Budget emphasizes productivity, fuel security, and investment, while Future Made in Australia commits A$22.7 billion over a decade to strategic industries (Budget 2026-27; Future Made in Australia). Those policies do not guarantee higher index levels, but they do improve the medium-term case for selective re-industrialisation and project pipelines.
5. Concentration risk. A market where the largest constituent is 11% and the top 10 are 48.6% of the benchmark can keep rallying, but it is not broadly diversified in practice (S&P Dow Jones Indices, S&P/ASX 200 Index (AUD) Factsheet, as of April 30, 2026). Bank de-rating or miner disappointment would matter more than in a more balanced index.
04. Institutional Forecasts and Analyst Views
Institutions are constructive on Australian equities, but not on a straight-line path
No major institution in the current source set is publishing a single official ASX 200 target for 2030, and investors should treat that absence as healthy rather than inconvenient. What the institutions do provide is a directional mosaic. AMP sees more upside in Australian shares, helped by returning profit growth, yet also warns that rich valuations, a more hawkish RBA, and global risks should make the ride bumpy. Fidelity Australia expects volatility but argues that resources, selected financials, and practical AI adoption can still create opportunity. BlackRock Australia focuses more on the domestic rate shock and tighter financial conditions, which is a useful counterweight to the equity optimism.
The macro institutions point in a similar direction. The OECD sees growth improving from 1.8% in 2025 to 2.3% in 2026 and 2.4% in 2027. The IMF described Australia as managing a soft landing, but also noted that underlying inflation had moved back above 3% in late 2025. That combination is constructive for earnings but not clean enough to justify an aggressive valuation rerating.
| Source | What it is saying | Implication |
|---|---|---|
| AMP | More upside is possible, but rich valuations and a hawkish RBA argue for a bumpy path. | Supports a constructive base case, not a euphoric one. |
| Fidelity Australia | Volatility should create stock-picking opportunity, with resources and practical AI use increasingly important. | Suggests leadership may broaden beyond the banks. |
| OECD | Growth should improve through 2027 if productivity and housing constraints are addressed. | Supports earnings growth assumptions in the base case. |
| IMF | Soft landing remains intact, but inflation re-acceleration complicates policy. | Explains why multiples may not expand much from here. |
05. Scenarios, Risks, and Invalidation
A sensible 2030 forecast uses ranges, conditions, and explicit probabilities
Bullish scenario
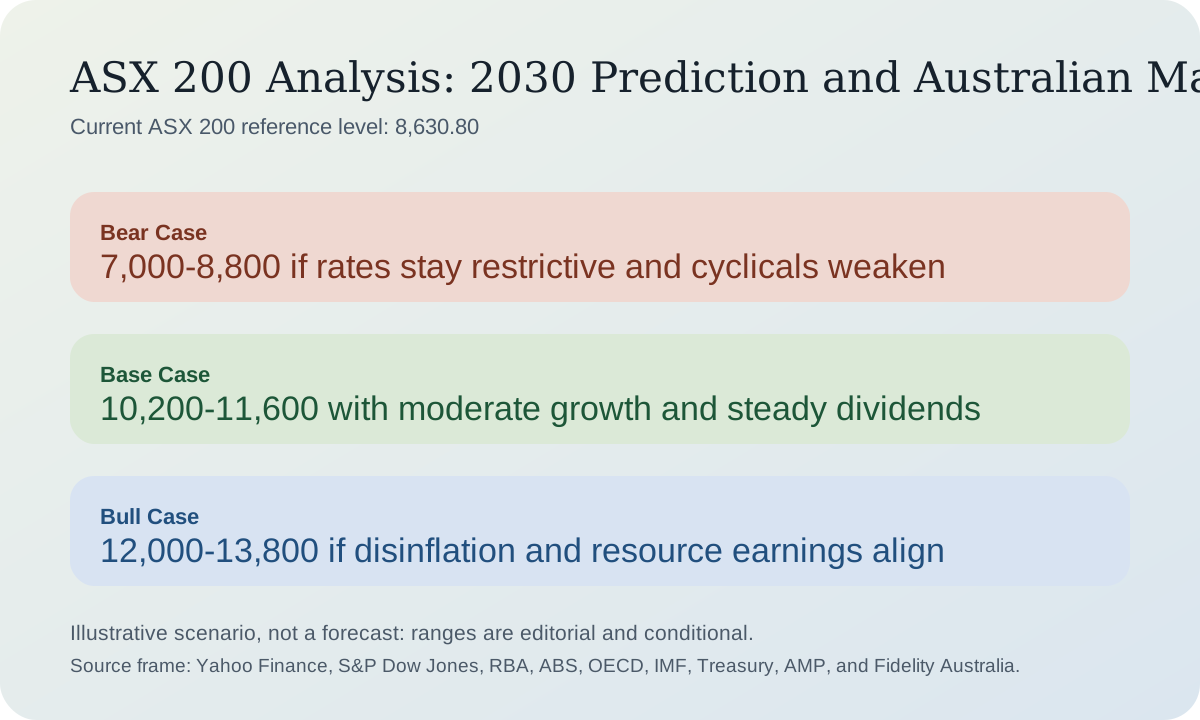
The bull case is 12,000 to 13,800 by 2030. This would likely require inflation to normalize without a severe domestic slowdown, bank earnings to stay resilient, commodity demand to remain firm, and policy support for critical minerals, infrastructure, and productivity to generate higher capital spending. It also assumes the income appeal of Australia remains attractive if global investors rotate away from the most crowded U.S. growth trades.
Bearish scenario
The bear case is 7,000 to 8,800. That outcome would fit a world where China demand softens materially, commodity prices roll over, bank multiples compress under sticky rates and housing stress, and the RBA remains trapped by inflation. The evidence is mixed because the ASX yield cushion often limits the damage, but the concentration risk is real.
Base-case scenario
The base case is 10,200 to 11,600. This assumes Australia keeps growing modestly, dividends remain meaningful, and the market compounds somewhat faster than inflation but slower than the strongest global growth benchmarks. That is a relatively conservative extension of the benchmark's own long-run price behavior.
| Scenario | 2030 range | Conditions | Probability |
|---|---|---|---|
| Bull | 12,000-13,800 | Inflation cools, rates stabilize, banks keep paying, commodities stay firm, and policy support lifts investment | 25% |
| Base | 10,200-11,600 | Moderate GDP growth, mixed but manageable inflation, solid dividends, and no major China shock | 50% |
| Bear | 7,000-8,800 | Sticky inflation, weaker resources, bank de-rating, and a more prolonged domestic slowdown | 25% |
| Path | Estimated probability | Comment |
|---|---|---|
| Rising | 52% | The market still has structural support from dividends, banking profitability, and resource exposure. |
| Falling | 20% | A lower path likely needs both macro and sector pressure rather than one isolated disappointment. |
| Sideways | 28% | Very plausible if earnings grow but multiples stay constrained by a higher-rate regime. |
Risks to watch
Monitor trimmed mean inflation, RBA rate guidance, ABS labor-market resilience, iron ore and copper pricing, Chinese industrial demand, and whether the budget's productivity agenda actually translates into private investment.
What could invalidate the forecast
This base case would be too bullish if inflation stays elevated for much longer and forces a sustained de-rating in banks, REITs, and domestic cyclicals. It would be too bearish if the market receives both a commodity tailwind and a cleaner disinflation path than current data suggest.
Conclusion
The ASX 200 can plausibly be higher by 2030, but a realistic forecast should look more like disciplined compounding than a speculative breakout. Historical data, current market conditions, and institutional commentary all support a constructive range-based view rather than certainty.
Disclaimer: This article is for research and informational purposes only. The scenario ranges and probabilities are editorial judgments built from public data, not financial advice or guaranteed outcomes.
06. Investor Positioning
Different investor profiles need different levels of patience and risk control
| Investor type | Cautious approach | Why it fits the setup |
|---|---|---|
| Investor already in profit | Hold core exposure, but trim concentration if banks or miners dominate the portfolio. | The index can keep compounding, but a benchmark this concentrated should still be rebalanced. |
| Investor currently at a loss | Avoid capitulating into routine volatility; reassess whether the original thesis depended on rate cuts arriving too quickly. | The current setup is not clean enough to justify emotional selling or blind averaging. |
| Investor with no position | Use staged entries or wait for pullbacks rather than chasing rebounds toward the top of the 52-week range. | Australia still offers yield and quality, but it is not a low-risk momentum trade. |
| Trader | Use stop-losses and watch the RBA, China data, bank earnings, and commodity moves closely. | Short-term ASX direction is often macro-led rather than story-led. |
| Long-term investor | Dollar-cost average into diversified exposure and let dividends do part of the return work. | The longer-term case is steadier total return, not Nasdaq-style excitement. |
| Risk-hedging investor | Use the ASX as a value-income sleeve and rebalance against richer growth markets. | The benchmark can help diversify global tech concentration, but it is not immune to cyclical drawdowns. |
07. FAQ
Frequently asked questions about the ASX 200 outlook
Why not publish a single ASX 200 target for 2030?
Because the macro variables that matter most, including inflation, RBA policy, commodity prices, and China demand, are too uncertain to justify false precision. A range is more defensible than a slogan.
Does the ASX 200 still offer long-term value if U.S. markets keep dominating?
Potentially yes, mainly through dividends, sector diversification, and lower direct exposure to expensive growth narratives. But it is still a cyclical market, not a pure defensive haven.
What is the biggest single risk to the 2030 base case?
A prolonged combination of sticky inflation and weaker commodity demand. That would pressure both banks and miners at the same time.
References
Sources
- Yahoo Finance chart API for ^AXJO, 10-year monthly history
- Yahoo Finance chart API for ^AXJO, one-month daily history
- Yahoo Finance chart API for ^AXJO, one-year daily history
- S&P Dow Jones Indices, S&P/ASX 200 Index (AUD) Factsheet, as of April 30, 2026
- Reserve Bank of Australia, Statement by the Monetary Policy Board: Monetary Policy Decision, May 5, 2026
- Reserve Bank of Australia, Statement on Monetary Policy, May 2026
- Australian Bureau of Statistics, Consumer Price Index, Australia, March 2026
- Australian Bureau of Statistics, Labour Force, Australia, March 2026
- OECD Economic Surveys: Australia 2026
- IMF Executive Board Concludes 2025 Article IV Consultation with Australia, published February 15, 2026
- Australian Government Budget 2026-27 overview
- Australian Treasury, Future Made in Australia
- AMP, The outlook for Australian shares – is the long underperformance over?
- Fidelity Australia, A word on: Australian equities