01. Quick Answer
Bitcoin’s 2030 outlook still leans constructive, but the right way to frame it is as a cycle-transition story rather than a straight-line moonshot
The most defensible 2030 Bitcoin view is constructive but conditional. Available data suggests BTC has become more institutional, more liquid, and more tightly linked to macro liquidity than in prior cycles. That supports the case for materially higher prices by 2030 than today’s roughly $76,864 close on May 18, 2026. But it does not justify treating every ultra-bull forecast as a base case. A sober 2030 range has to balance scarce supply and adoption tailwinds against regulation, leverage, and macro drawdown risk.
| Category | Evidence-based read | Implication |
|---|---|---|
| Historical data | BTC rose from roughly $575 in August 2016 to a monthly closing high near $115,758 in July 2025 | Long-term upside is real, but so is path-dependent volatility |
| Current market conditions | BTC is trading well below the 2025 peak after a deleveraging phase, not in a clean breakout regime | 2030 forecasts should assume turbulence, not a smooth climb |
| Institutional signals | SEC-approved spot ETPs, Fidelity’s market-maturity work, Strategy’s treasury accumulation, and CME’s growth all matter | Bitcoin is increasingly behaving like a maturing macro asset |
| Working base case | BTC can plausibly revisit and exceed prior highs if liquidity and adoption broaden, but the evidence is mixed on how fast | A scenario range is more honest than one heroic target |
02. Historical Context
The 2030 question starts with how different this cycle already looks from 2017 and 2021
BTC’s last decade matters because it shows both extraordinary wealth creation and severe instability. Using Yahoo Finance monthly closes, Bitcoin traded near $575 in August 2016, then moved through the 2017 boom, the 2018 collapse, the 2020–2021 liquidity surge, the 2022 washout, and the mainstream cycle that culminated in a monthly close around $115,758 in July 2025. That is a staggering appreciation curve, but it also contains multiple 50% to 80% drawdowns. Any 2030 forecast that ignores those drawdowns is not doing financial analysis. It is doing marketing.
What has changed is market structure. Fidelity’s February 24, 2026 research argued that Bitcoin’s four-year cycle may be weakening as the asset becomes larger and more liquid, noting an all-time high market capitalization of approximately $2.5 trillion in October 2025 and a pattern in which volatility decreased even as price pushed above $126,000. That is a meaningful departure from earlier cycles, when blow-off tops and collapsing volatility regimes were more tightly linked. The evidence is not conclusive, but it is strong enough to take seriously.
| Metric | Latest reading | Why it matters |
|---|---|---|
| Recent BTC close | ~$76,864 on May 18, 2026 | Shows how far BTC still sits below the 2025 peak after the deleveraging reset |
| 1-month range | Roughly $76.9k to $82.1k in recent daily closes | Suggests stabilization, but not decisive trend recovery |
| Spot ETP share | Fidelity said U.S. spot bitcoin ETPs held nearly 1.3 million BTC as of January 30, 2026 | Locks a meaningful slice of supply into regulated wrappers |
| Public-company demand | Strategy reported 818,334 BTC held as of May 3, 2026 | Corporate treasury demand remains concentrated but influential |
| Period | Approximate price anchor | Read-through for 2030 |
|---|---|---|
| 2016 | $575-$745 | BTC was still a niche asset with shallow institutional support |
| 2020 | ~$29,175 year-end per Bitwise cycle table | Liquidity and halving effects still dominated the narrative |
| 2024 | ~$93,393 year-end per Bitwise | Mainstreamization and ETF access accelerated demand |
| 2025 | Above $126,000 at the cycle high per Fidelity/Glassnode reference | Institutional adoption matured, but leverage still created violent reversals |
| 2026 YTD | ~$66,996 to ~$79,066 monthly closes so far | The market is digesting excesses rather than trending in one direction |
03. Main Drivers
Five drivers will probably matter more than social-media narratives between now and 2030
1. ETF and platform access continue to absorb supply
The SEC’s January 10, 2024 approval of spot Bitcoin ETPs was a structural event, not just a headline. Fidelity later reported that by January 30, 2026 those vehicles collectively held nearly 1.3 million BTC, or 6.4% of circulating supply. Bitwise added that since launch, spot Bitcoin ETFs had purchased far more BTC than new supply issued over the same period. That does not guarantee higher prices, because legacy holders can always sell, but it creates a durable demand channel that did not exist in prior cycles.
2. Bitcoin’s supply story is still powerful, even if each halving matters less at the margin
Bitcoin Core’s validation rules still enforce the 21 million supply limit. Bitwise is right to note that each halving becomes less mechanically important over time, but “less important” is not the same as “irrelevant.” A finite issuance schedule still matters when institutional vehicles, public companies, and reserve-style holders are competing for a supply base that many long-term owners do not trade actively.
3. Macro liquidity and rate direction remain decisive
Fidelity’s 2026 outlook explicitly linked Bitcoin to liquidity conditions, describing scarce assets like BTC as a potential “liquidity sponge” when M2 expands. That is why 2030 ranges should not be built from crypto-native demand alone. If central banks are easing into slow nominal growth, BTC could benefit. If inflation stays sticky and real rates stay high, the evidence is mixed.
4. Treasury adoption and reserve optics have become part of the demand stack
Strategy’s treasury strategy remains the cleanest example. The company reported 818,334 BTC held as of early May 2026, and White House policy in March 2025 formally established a Strategic Bitcoin Reserve using forfeited BTC. That does not mean nation-state adoption will explode, but it does mean the reserve-asset debate has moved from fringe theory to official policy architecture.
5. Regulated derivatives and deeper liquidity cut both ways
CME said its crypto suite facilitated nearly $3 trillion in notional futures and options trading in 2025, with average daily open interest rising sharply and institutional participation reaching record levels. That is bullish for market depth and price discovery. It is also a reminder that Bitcoin now lives inside a larger derivatives ecosystem where volatility can be expressed cleanly, hedged more efficiently, and occasionally accelerated.
04. Institutional Forecasts and Analyst Views
The published 2030 targets are wide because the assumptions are radically different
Institutional Bitcoin forecasts for 2030 are best read as assumption stacks. ARK’s official 2030 bear, base, and bull cases are roughly $300,000, $710,000, and $1.5 million per bitcoin, built around Bitcoin’s penetration into institutional portfolios, digital-gold demand, emerging-market safe-haven demand, nation-state reserves, corporate treasuries, and on-chain financial services. ARK itself warns that the forecasts are hypothetical and highly speculative, which is exactly the right caveat.
Fidelity is more restrained in tone. Its cycle research did not publish a formal 2030 target, but it noted that if market value reached four times realized value in the current cycle, that would imply a market cap of roughly $4.5 trillion and a BTC price near $225,000 as of February 2, 2026. Galaxy focused nearer-term, saying BTC could hit $250,000 by year-end 2027 while also admitting 2026 was too chaotic to predict cleanly. Bitwise took a similar stance, arguing 2026 could break the old four-year-cycle pattern because ETF demand and institutional distribution have changed the setup.
| Source | Published view | What it assumes | Read-through |
|---|---|---|---|
| ARK Invest | $300k bear, $710k base, $1.5M bull by 2030 | Portfolio adoption, digital-gold substitution, EM safe-haven use, treasury demand | Useful upside map, but highly assumption-sensitive |
| Fidelity Digital Assets | No official 2030 target; ~$225k implied under a higher MVRV framework as of Feb. 2026 | Bitcoin behaves more like a maturing macro asset with lower volatility | Supports a higher floor more than a precise ceiling |
| Galaxy Research | $250k by year-end 2027 | Institutional access broadens, but near-term remains unstable | Suggests upside can still be large before 2030 if macro cooperates |
| Bitwise | New all-time highs in 2026 and ETF demand above new supply | Institutional demand overwhelms issuance and weakens the old cycle template | Constructive medium-term signal, not a full 2030 model |
That spread is why the evidence is mixed on exact 2030 pricing. A point estimate is less useful than a disciplined range. The more helpful question is not whether BTC reaches one sensational number, but which conditions are required for the lower, middle, or upper band to make sense.
05. Bull, Bear, and Base Case
A scenario matrix is more credible than a single number because 2030 depends on adoption, liquidity, and macro regime
| Scenario | 2030 range | Conditions | Probability |
|---|---|---|---|
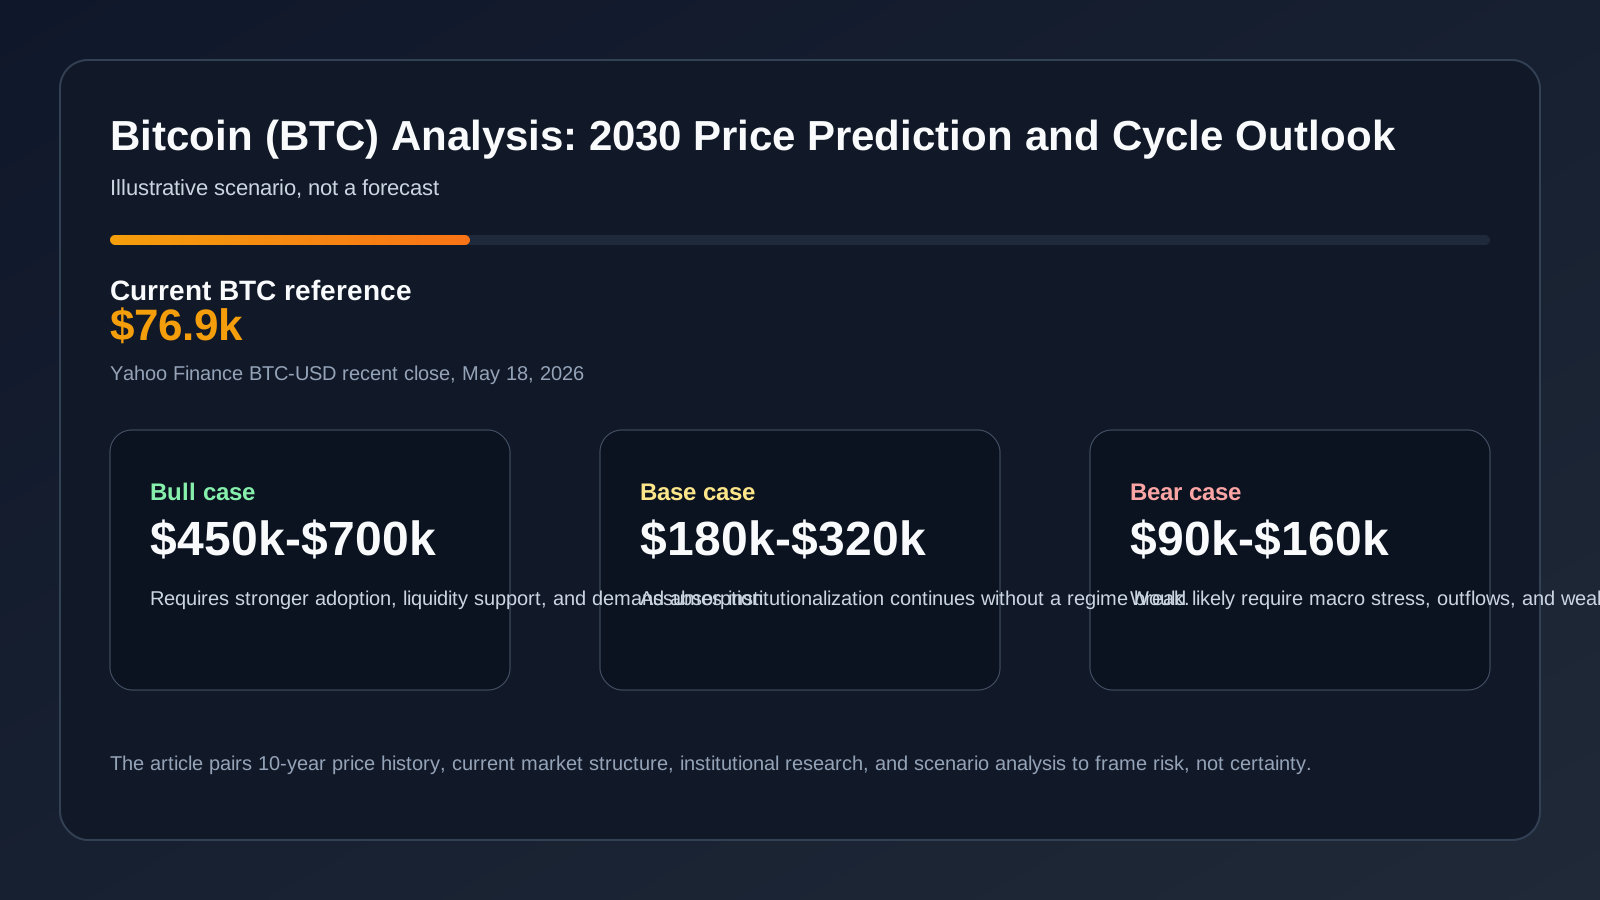
| Bull | $450k-$700k | ETF and advisory-platform adoption keep rising, more public companies adopt BTC, reserve policy remains supportive, and global liquidity turns decisively easier | 25% |
| Base | $180k-$320k | BTC clears prior highs, institutionalization deepens, but adoption is slower and less dramatic than ARK’s base case | 45% |
| Bear | $90k-$160k | BTC survives and remains relevant, but persistent macro pressure, weaker inflows, and periodic regulatory setbacks cap upside | 30% |
| Direction | Probability | Comment |
|---|---|---|
| Higher by 2030 | 48% | The structural evidence still favors a higher long-run level than the 2026 price |
| Lower | 20% | A durable break lower would likely require macro tightening, outflows, and renewed confidence shocks |
| Sideways to moderate gains | 32% | Plausible if BTC remains institutionally relevant but does not unlock the more aggressive adoption cases |
| Investor type | Prudent approach | Main watchpoints |
|---|---|---|
| Investor already in profit | Hold a core position, but rebalance if BTC has become an outsized share of portfolio risk | ETF flows, liquidity conditions, and tax discipline |
| Investor currently at a loss | Avoid emotional averaging unless the original thesis still fits your time horizon and sizing rules | Market structure, cost basis, and leverage exposure |
| Investor with no position | Dollar-cost averaging or waiting for pullbacks is usually cleaner than chasing vertical moves | Trend confirmation above prior resistance zones |
| Trader | Use stop-loss discipline and respect BTC’s tendency to overrun both bullish and bearish consensus | CME volatility, funding, and ETF flow data |
| Long-term investor | Build slowly if you believe BTC is maturing into a macro reserve asset, but size for volatility | Policy, adoption breadth, and custody concentration |
| Risk-hedging investor | Treat BTC as one potential hedge among several, not a guaranteed crisis hedge | Dollar strength, rates, and correlation spikes in stress events |
What could invalidate the constructive 2030 case? A prolonged period of high real rates, disappointing ETF adoption outside early movers, a major regulatory reversal, or evidence that public-company and reserve demand were mostly cyclical rather than structural would all weaken it materially. Conversely, what could invalidate the cautious view? Faster advisory-platform adoption, broader sovereign signaling, and a renewed breakout in macro liquidity would push the range upward faster than this framework assumes.
06. FAQ
Frequently asked questions
Is Bitcoin still following a four-year cycle?
Fidelity argues the evidence increasingly points to a weaker cycle effect as Bitcoin becomes larger, more liquid, and more institutional. That does not mean volatility disappears. It means the old pattern may be less mechanically reliable.
Why not just use ARK’s $710,000 base case?
Because ARK’s model is useful but highly assumption-driven. If institutional penetration, emerging-market demand, or digital-gold substitution undershoot, the realized path could be much lower.
What matters most between now and 2030?
Liquidity, ETF and treasury demand, regulatory treatment, and whether BTC can keep absorbing supply without depending on leverage-fueled speculation.
Could BTC still underperform despite adoption headlines?
Yes. The evidence is mixed because adoption can improve while macro conditions worsen. BTC is still a risk asset during many stress episodes.
Methodology and Invalidation
How to interpret this Bitcoin 2030 framework and what would change it
The forecast ranges in this article are scenario bands, not promises. They combine live price data from Yahoo Finance, 10-year context, post-ETF market structure, public-company treasury activity, adoption research, regulated derivatives activity, and institutional commentary from firms such as ARK, Fidelity, Bitwise, Galaxy, and CME. That mix is helpful because bitcoin does not respond to a single variable. It reacts to liquidity, regulation, leverage, adoption, macro sentiment, and the behavior of long-term holders at the same time.
Probability tables in this article are editorial estimates rather than mathematical certainties. They are derived by asking which path currently has the strongest evidence: renewed accumulation and broader institutionalization, prolonged consolidation after the 2025–2026 reset, or a deeper repricing caused by macro stress and forced selling. Where the evidence is mixed, the range stays wide on purpose. False precision is usually a sign that the analyst is hiding uncertainty rather than measuring it honestly.
The most important discipline is to state what would invalidate the working view. The clearest invalidators would be a sustained failure to attract broad institutional allocations, a regime of persistently restrictive real rates, or a structural loss of confidence in custody, market integrity, or regulation. Investors who are already in profit, investors sitting on losses, traders, hedgers, and long-term allocators do not need the same playbook, so the positioning table separates horizon and risk tolerance instead of pretending one answer fits everyone. Disclaimer: This article is for informational and research purposes only and does not constitute personalized financial advice.
References
Sources
- Yahoo Finance BTC-USD chart API, 10-year monthly price history
- Yahoo Finance BTC-USD chart API, recent daily closes
- U.S. SEC, statement on the approval of spot Bitcoin exchange-traded products, January 10, 2024
- ARK Invest, Bitcoin 2030 price-target methodology, April 24, 2025
- Fidelity Digital Assets, Is Bitcoin’s Four-Year Cycle Over?, February 24, 2026
- Fidelity Digital Assets, 2026 Look Ahead report
- Strategy, first-quarter 2026 results and bitcoin treasury update, May 5, 2026
- Chainalysis, 2025 Global Crypto Adoption Index
- CME Group, Crypto Catch-Up Q4 2025
- The White House, Strategic Bitcoin Reserve executive order, March 6, 2025
- Cambridge Centre for Alternative Finance, Bitcoin electricity consumption methodology
- Bitwise, 10 Crypto Predictions for 2026
- Galaxy Research, 26 crypto, bitcoin, DeFi, stablecoin, and AI predictions for 2026
- Bitcoin.org, Bitcoin Core validation and the 21 million supply rule