01. Quick Answer
Gold's post-rally outlook still leans constructive, but the easy part of the move is likely behind it
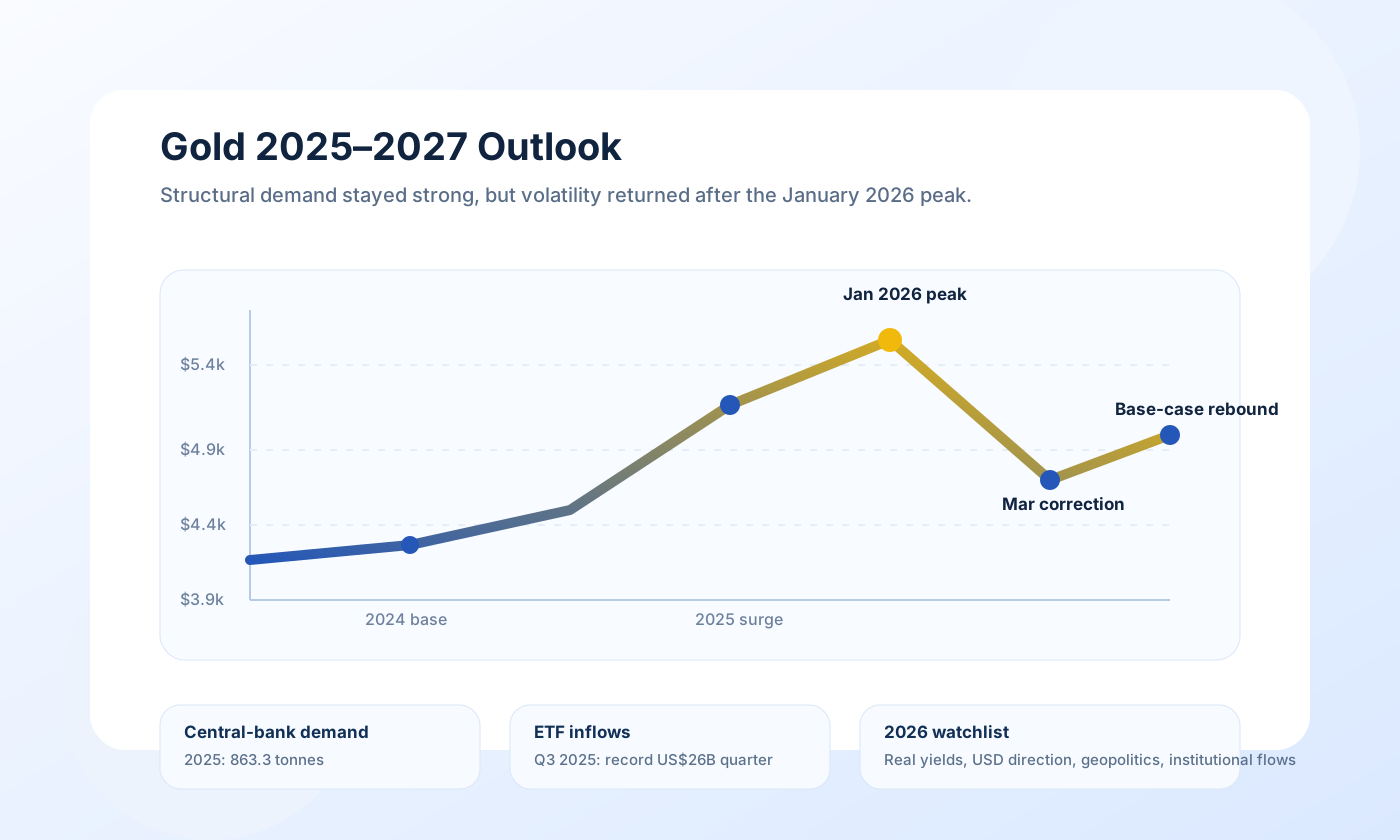
The post-bull-run answer is not "gold must crash" and it is not "gold can only go up." The most defensible view is that gold has already repriced into a higher structural regime thanks to reserve diversification, strong official-sector buying, rising fiscal stress, and a broadening investor base. But the move from here to 2027 likely depends more on rates, ETF participation, and how much geopolitical premium remains than on the structural story alone.
World Gold Council analysis published at the end of 2025 suggested a central 2026 case of roughly 5%-15% upside from then-current levels, while an extreme risk-off case could support gains of 15%-30%. J.P. Morgan's December 2025 outlook was even stronger, with gold averaging $5,055 in the fourth quarter of 2026 and pushing toward $5,400 by late 2027. Those forecasts are not guarantees. They are conditional on the supportive forces staying in place.
| Topic | Base reading | Why it matters |
|---|---|---|
| Historical data | Gold was already in a multi-year bull cycle before 2026 | The rally is not just a single geopolitical spike |
| Current conditions | Technically softer than January, structurally still intact | WGC sees key support near $4,075 in April 2026 commentary |
| Institutional forecasts | Still mostly constructive | J.P. Morgan, LBMA survey, and WGC scenarios all imply elevated price persistence |
| Main risk | Higher real yields and weaker ETF participation | Those are the fastest ways to slow or reverse momentum |
02. Historical Context
The 2025-2026 run looks exceptional, but prior cycles still offer useful framing
Gold demand and pricing data from the World Gold Council show 2025 was not just another good year. Total demand hit a record 5,002 tonnes, annual investment demand reached 2,175 tonnes, ETF inflows added 801 tonnes, and mine supply also hit a record 3,672 tonnes. That combination matters because it says the rally was not built on one narrow flow channel. It included central banks, Western ETFs, Asian bar-and-coin buying, and continued supply discipline.
By Q1 2026, the market was already changing character. WGC data showed total demand reached 1,231 tonnes, up 2% year over year, while physically backed ETF holdings still rose 62 tonnes in the quarter. But that quarter was also more uneven. January was extremely strong, and March showed meaningful liquidation pressure in Western funds as rates and the dollar moved higher. In other words, gold did not lose its structural support. It became more dependent on investor conviction.
| Indicator | Latest reliable reading | Signal |
|---|---|---|
| 2025 total gold demand | 5,002t | Record annual demand confirms broad participation |
| 2025 central-bank demand | 863t | Below the prior three years, but still historically high |
| Q1 2026 ETF holdings change | +62t | Supportive, though much slower than the previous four-quarter average |
| 10-year U.S. real yield | About 1.9% in early May 2026 | Still a headwind for gold relative to zero-yield regimes |
03. Main Drivers
Five variables are likely to determine the 2025-2027 path
1. Central-bank buying remains the most important floor
World Gold Council data show 2025 central-bank buying came in at 863 tonnes. That was below the extraordinary 1,000-plus-tonne years, but still far above the 2010-2021 annual average of 473 tonnes. WGC's 2025 central-bank survey also found that 95% of respondents expected official gold reserves to rise globally over the next 12 months and 43% expected their own institution to increase holdings. That is a floor few prior bull markets had.
2. Reserve diversification remains gradual but visible
The IMF's March 27, 2026 COFER brief put the U.S. dollar's share of allocated reserves at 56.77% in Q4 2025, down from much higher levels decades ago. This is not a dramatic collapse narrative. But it does show that marginal diversification continues and the "no alternative" case for the dollar is no longer stopping central banks from adding gold.
3. ETF flows are still the accelerator
Official-sector buying creates the base. ETF flows create the speed. WGC data show January 2026 was a record month for global gold ETF inflows at US$18.7 billion, and Q1 still finished with positive holdings growth despite a sharp March setback. If 2026-2027 sees only mild ETF demand, gold can still hold up. If ETF demand re-accelerates, the market can reprice much faster.
4. Real yields and Fed expectations are the main cyclical risk
Gold's biggest tactical challenge is simple: the metal is non-yielding, and real yields remain positive. FRED data showed the 10-year TIPS yield near 1.94% on May 6, 2026. WGC's April 2026 commentary explicitly said the Fed backdrop had become less gold-friendly as rate-cut expectations moved out. That means gold's structural story must work against a still-costly opportunity set.
5. Fiscal pressure keeps the long-term case alive
CBO's long-term budget outlook projects debt held by the public to reach 107% of GDP by 2029, above the prior historical peak. Even if that risk does not trigger an immediate market event, it reinforces the anti-fiat and reserve-diversification logic that supported gold in the first place.
That does not mean every deficit headline is automatically bullish for gold. Markets can ignore debt for long stretches when growth is resilient and funding conditions are stable. But for a 2025-2027 forecast, the point is narrower: fiscal pressure reduces the likelihood that gold simply falls back to the old pre-rerating regime unless several other supports weaken at the same time.
04. Institutional Forecasts
The institutional range is wide, but still tilted positive
| Source | Forecast reference | Interpretation |
|---|---|---|
| World Gold Council | +5% to +15% in 2026 central case; +15% to +30% in extreme risk-off case | Constructive, but scenario dependent |
| J.P. Morgan Global Research | $5,055 Q4 2026 average; around $5,400 by Q4 2027 | One of the more bullish major-bank forecasts |
| LBMA survey average | Analysts clustered broadly around the mid-$4,000s for 2026 | Consensus says elevated prices can persist |
| HSBC via LBMA survey | $4,586 average, range $3,950-$5,050 | Supportive but mindful of correction risk |
The range matters because it shows analysts are not debating whether gold belongs above its old regime. They are debating how much of the 2025-2026 premium proves durable into 2027.
05. Scenarios
Bull, bear, and base case for 2025-2027
| Scenario | Illustrative range | Key conditions | Probability |
|---|---|---|---|
| Bull | $5,200-$6,000 | ETF inflows re-accelerate, the Fed eases more than expected, and geopolitical stress stays elevated | 35% |
| Base | $4,300-$5,300 | Central-bank demand stays firm, but real yields and periodic profit-taking cap upside | 45% |
| Bear | $3,800-$4,300 | Real yields stay high, ETF flows turn negative, and the geopolitical premium compresses | 20% |
| Outcome | Probability | Reason |
|---|---|---|
| Net rise from current regime | 50% | Structural demand remains stronger than in prior cycles |
| Net decline | 20% | Would likely require durable real-yield pressure and softer ETF participation |
| Sideways but volatile | 30% | Likely if central banks support the floor while macro traders fade momentum |
06. Investor Positioning
Different investors should respond differently to the same gold chart
| Investor type | Prudent stance | Main watchpoints |
|---|---|---|
| Investor already in profit | Hold core exposure, but consider trimming tactical excess into sharp spikes | ETF flow momentum and rate expectations |
| Investor currently at a loss | Reassess entry horizon before averaging; avoid reflexive chasing after rebounds | Support around key technical zones and real yields |
| Investor with no position | Wait for pullbacks or use staged entries; avoid buying only on headlines | Whether central-bank demand and ETFs remain additive |
| Trader | Use stop-loss and respect volatility; gold can trade on rates faster than on fundamentals | Dollar, TIPS, options positioning |
| Long-term investor | Dollar-cost averaging or periodic rebalancing may be more sensible than all-in entries | Reserve diversification and fiscal trends |
| Hedge-focused investor | Gold still fits as a partial hedge, but sizing should reflect higher absolute price levels | Inflation surprises and stock-bond correlation |
Risks to watch are clear. A durable move higher in real yields, a stronger dollar, and broad equity resilience would all reduce urgency around safe-haven allocations. What could invalidate the medium-term bullish forecast would be a genuine breakdown in official demand or a decisive failure of gold to attract ETF inflows during periods of macro stress.
One additional nuance matters for positioning. Gold's role in a portfolio may still be useful even if the price path disappoints. For many allocators, the issue is not whether gold beats every asset in 2026 or 2027. It is whether gold still diversifies macro, policy, and geopolitical risk better than many alternatives when stocks and bonds become less reliable offsetting assets.
Conclusion: after XAU's historic bull run, the most likely next phase is not a simple repeat of 2025's straight-line momentum. It is a structurally supported but more selective market. The base case still leans constructive into 2027, but the path will probably include deeper corrections, more sensitivity to rates, and a larger role for investor discipline.
Disclaimer: This article is for informational purposes only and is not personalized financial advice.
07. FAQ
Frequently asked questions
Can gold still go higher after such a large rally?
Yes. Institutional and World Gold Council analysis still point to upside scenarios, but the rally is likely to become more conditional and more volatile.
What matters most in 2026-2027?
Real yields, ETF flows, and whether central-bank diversification remains strong.
Is $6,000 realistic before 2027?
It is possible in a bullish risk-off scenario, but it should not be treated as the default outcome.
What would make the outlook bearish?
A stronger dollar, persistent real-yield pressure, and loss of momentum in ETF demand would be the main bearish combination.
References
Sources
- World Gold Council, Full-Year 2025 Gold Demand Trends press release
- World Gold Council, Full-Year 2025 central-bank demand
- World Gold Council, Q1 2026 investment demand and ETF flows
- World Gold Council, Q1 2026 outlook
- World Gold Council, Gold Outlook 2026
- World Gold Council, Gold Market Commentary April 2026
- J.P. Morgan Global Research, Will gold prices break $5,000/oz in 2026?
- LBMA, 2026 Precious Metals Forecast Survey at a glance
- LBMA, 2026 Precious Metals Forecast Survey analyst forecasts
- IMF Data Brief, COFER Q4 2025
- FRED, 10-year TIPS real yield series
- Congressional Budget Office, The Long-Term Budget Outlook: 2025 to 2055