01. Quick Answer
HG Prediction for 2027: Supply, Demand, and Price Risks
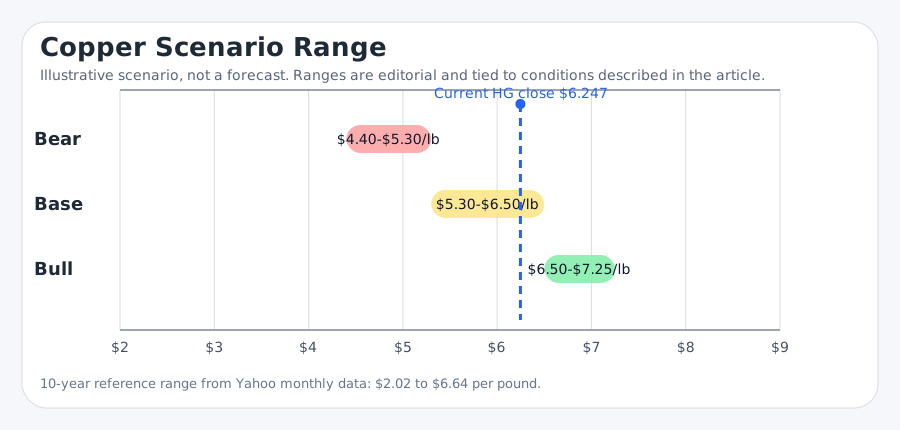
The quick answer is that 2027 probably lands below the most euphoric shortage narratives, but above the old pre-electrification average. That points to a base-case range of $5.30-$6.50/lb, with upside if deficits deepen and downside if refined surplus conditions prove larger or longer than expected.
With current HG already near $6.247/lb and the World Bank still projecting a 2027 average of $11,000/t, or roughly $4.99/lb, investors should assume volatility around the base case rather than a straight glide path (World Bank, Commodity Markets Outlook, April 2026; Yahoo Finance chart API, HG=F recent daily data).
| Category | Evidence-based read | Implication |
|---|---|---|
| Near-term balance | ICSG sees the refined market in a modest 2026 surplus. | That limits the case for assuming every new high is durable. |
| Institutional tension | UBS stays very bullish, while the World Bank and Citi allow for cooling from current peaks. | Analysts remain divided because timing is the hard part. |
| Risk profile | 2027 is highly sensitive to China, inventories, and trade-policy frictions. | Macro execution matters more here than in a 2035 thesis. |
| Prudent stance | A scenario range is more honest than a single number. | Short-horizon copper forecasts should be updated often. |
02. Historical Context
Current market snapshot and historical context
Short-horizon copper forecasts still need historical context. Over the last decade, moves from extreme pessimism to supply panic have repeatedly overshot, then retraced. That is why 2027 should be framed as a range with explicit risks rather than a fixed destination.
| Metric | Latest read | Why it matters |
|---|---|---|
| Current price | $6.247/lb | Shows the market is entering 2027 from an elevated starting point |
| World Bank 2027 avg | $11,000/t | Official baseline implies some cooling from current HG levels |
| Citi base case | $12,000/t by Q4 2026 | Constructive but below the most aggressive bank targets |
| UBS tactical upside | $15,000/t by March 2027 | Illustrates how wide the near-term institutional range already is |
| Period marker | Approximate price | Interpretation |
|---|---|---|
| 10-year low | $2.02/lb | The monthly series bottomed near this level during the 2016 industrial slowdown. |
| 2020 shock reset | around $2.10/lb | Copper sold off during the pandemic shock before reopening demand changed the trend. |
| 2021 reopening high | near $4.89/lb | Electrification optimism and supply friction started to re-rate the metal. |
| 2024–2026 re-rating | $5.20 to $6.64/lb | Tighter supply, tariffs, AI-related power demand, and mine disruptions pushed HG into a higher regime. |
| Latest close | $6.247/lb | Yahoo daily data puts HG near cycle highs on May 18, 2026. |
03. Main Drivers
Main drivers of price movement
1. The refined balance can still overpower the structural story
ICSG's current outlook for a 2026 refined surplus is small, but it matters because it reminds investors that temporary easing is possible even while long-run supply remains problematic.
2. China remains the swing demand variable
Goldman explicitly tied a short-term forecast upgrade to resilient Chinese demand. If that resilience fades, 2027 upside becomes harder to defend.
3. Tariffs and inventory relocations can distort price discovery
Regional tightness can keep COMEX and LME moving differently from what a clean global-balance model would imply.
4. Scrap and secondary output matter more in a 2027 forecast than in a 2035 story
The faster scrap responds, the more likely copper cools before the next leg of the structural shortage thesis returns.
5. Mine disruptions still cap the downside
Even a soft macro tape can be overwhelmed by setbacks in Chile, Indonesia, the DRC, or major smelter bottlenecks.
04. Institutional Forecasts and Analyst Views
Institutional forecasts and analyst views
The current institutional map is unusually wide for such a short horizon. That is the signal. Analysts are not debating whether copper is strategically important. They are debating how much scarcity premium should remain in the price by 2027.
| Source | Forecast / signal | Interpretation |
|---|---|---|
| World Bank | $11,000/t average in 2027 | Suggests cooling from conflict- and disruption-driven spikes |
| ICSG | Refined surplus in 2026 and larger surplus in 2027 | Balances could soften if demand slows and secondary output rises |
| UBS | $15,000/t by end-March 2027 | A deficit-heavy, shortage-premium view |
| Goldman Sachs | $12,650/t average in 2026 | Maintains a high near-term average even while discussing surplus conditions |
| Citi | Base case near $12,000/t by Q4 2026 | Constructive but less aggressive than UBS |
05. Bull, Bear, and Base Case
How the forecast range and probability table are built
The range in this article is editorial and scenario-based rather than a deterministic forecast. It starts with current HG pricing, the 10-year trading band, the World Bank near-term baseline, ICSG balance data, and structural demand evidence from IEA, S&P Global, and BHP.
| Scenario | Price range | Conditions | Probability |
|---|---|---|---|
| Bull | $6.50-$7.25/lb | Mine disruptions persist, inventories stay tight, and Chinese demand holds up better than feared | 30% |
| Base | $5.30-$6.50/lb | Copper remains expensive but oscillates as surplus and shortage narratives alternate | 40% |
| Bear | $4.40-$5.30/lb | A larger refined surplus, softer global growth, and better scrap supply compress the premium | 30% |
| Direction | Probability | Comment |
|---|---|---|
| Higher in 2027 | 35% | Possible, but current price already reflects much of the tightness thesis |
| Lower in 2027 | 30% | A plausible correction path if surplus conditions broaden |
| Sideways with violent swings | 35% | The most realistic short-horizon outcome for an already-elevated copper market |
| Investor type | Prudent approach | Main watchpoints |
|---|---|---|
| Investor already in profit | Protect gains with trailing stops or partial trims rather than anchor on the highest bull target. | 2027 is vulnerable to sharp tactical reversals. |
| Investor currently at a loss | Do not let a long-term copper story automatically rescue a short-term entry mistake. | Rebuild the thesis from current balance data. |
| Investor with no position | Wait for pullbacks, spreads normalization, or clearer confirmation from inventories. | Near-term price discipline matters. |
| Trader | Focus on data cadence: inventories, Chinese imports, treatment charges, and policy headlines. | HG can gap before fundamentals are obvious. |
| Long-term investor | Keep 2027 risk small relative to a longer copper thesis and avoid overtrading the noise. | The secular story is bigger than one calendar year. |
| Risk-hedging investor | Use options or diversified materials exposure if the goal is hedging inflation or infrastructure costs. | Single-direction futures exposure may be too blunt. |
The best 2027 copper forecast is not the loudest one. It is the one that respects how much scarcity premium is already in the price while still recognizing that mine disruptions and electrification keep the floor higher than in prior cycles. The base case therefore leans high but not euphoric. Disclaimer: This article is for informational and research purposes only and does not constitute personalized financial advice.
06. FAQ
Frequently asked questions
Why is the 2027 range tighter than the 2030 or 2035 ranges?
Because more near-term forecasts exist, and because the market is already pricing in current shortages.
Can copper really fall if the long-term outlook is strong?
Yes. Short-term surpluses, weaker growth, or tariff-driven inventory shifts can pressure prices materially.
Why is UBS so much more bullish than the World Bank baseline?
They are using different assumptions about deficits, disruptions, and how much current tightness persists into 2027.
What would invalidate the cautious 2027 base case?
A deeper-than-expected deficit and persistent mine disruptions would push the range higher.
Methodology and Invalidation
How to interpret this framework and what would change it
This forecast weights short-horizon balance data more heavily than long-run structural narratives. That means ICSG, World Bank, UBS, Goldman, and Citi signposts carry more weight here than 2040 electrification models, even though those longer-run models still inform the floor (Reuters on ICSG April 2026 forecast update; World Bank, Commodity Markets Outlook, April 2026; UBS CIO, commodities note, February 27, 2026; Reuters on Goldman Sachs maintaining a 2026 copper average forecast of $12,650/t; Reuters on Citi's copper base case near $12,000/t by Q4 2026).
The current HG price is unusually important because it changes the distribution of outcomes. A market already near cycle highs has less room for error if Chinese demand slows or scrap flows improve (Yahoo Finance chart API, HG=F recent daily data; Reuters on Goldman Sachs raising short-term copper forecasts on resilient Chinese demand).
Invalidation would come from either direction. A larger refined surplus and softer macro backdrop would lower the range. Persistent disruptions, tighter spreads, and stronger-than-expected demand would raise it. Because this is a shorter-horizon article, the framework should be reviewed frequently as new balance data arrives.
It is also important to separate a correction from a broken thesis. If HG falls from current levels toward the lower half of the range while mine supply still struggles and long-run capex remains under pressure, that would still be a cyclical adjustment rather than proof that copper's structural role has disappeared. Short-horizon investors often confuse those two regimes.
References
Sources
- Yahoo Finance chart API, HG=F 10-year monthly data
- Yahoo Finance chart API, HG=F recent daily data
- World Bank, Commodity Markets Outlook, April 2026
- ICSG, Table 1: World refined copper production and usage trends, April 2026
- Reuters on ICSG April 2026 forecast update
- IEA, Copper report within Global Critical Minerals Outlook 2024
- IEA, Global Critical Minerals Outlook 2025 overview
- IEA chart, mined supply and demand outlook for copper, 2026-2035
- S&P Global, Copper in the Age of AI: Challenges of Electrification, January 2026
- S&P Global, Plugged in and politicized: Copper in a fractured world
- BHP, Copper Growth
- BHP Insights, How copper will shape our future
- IMF, World Economic Outlook, April 2026
- USGS, Mineral Commodity Summaries 2026
- UBS CIO, commodities note, February 27, 2026
- Reuters on Goldman Sachs maintaining a 2026 copper average forecast of $12,650/t
- Reuters on Goldman Sachs raising short-term copper forecasts on resilient Chinese demand
- Reuters on Citi's copper base case near $12,000/t by Q4 2026