01. Quick Answer
The most likely 2027 outcome is a wide but upward-tilted trading range
Available data suggest the HSI enters the next 12 to 24 months with better support than it had during the worst part of the downturn, but not with enough evidence to justify certainty. The Q1 2026 GDP release showed 5.9% real growth, the HKEX monthly report showed healthy turnover and market capitalization, and Invesco remains constructive on Chinese equities and Hong Kong inflows. Against that, the IMF still flags elevated external and domestic downside risks, while the Property Review shows office oversupply is still real. For 2027, that mix points to a base case of moderate upside with frequent setbacks rather than a one-way bull market.
| Point | Why it matters |
|---|---|
| Historical data still matters | The HSI's 2.25% 10-year price CAGR shows why scenario analysis is more credible than one-line optimism. |
| Current conditions are better, not solved | GDP, turnover, and market activity improved, but CRE and geopolitics still limit certainty. |
| Institutional views are constructive but conditional | Public research from IMF, Invesco, UBS, Goldman Sachs, and J.P. Morgan supports nuance rather than hype. |
| Forecast ranges must separate bull, bear, and base cases | The evidence is mixed enough that any serious HSI forecast should explain why probabilities differ across scenarios. |
02. Historical Context
The HSI's last decade explains why long-run forecasting must stay humble
The Hang Seng Index has not behaved like a simple developed-market benchmark. Yahoo Finance data show a move from 20,794.37 on 2016-05-31 to 25,962.73 on 2026-05-15, a price CAGR of only 2.25%. That flat-looking long-run path hides extremely large cycles inside the range: the index fell as low as 14,687.02 and reached 32,887.27 during the same decade. In other words, the HSI has been much better at repricing macro expectations than at compounding smoothly.
| Metric | Latest reading | Why it matters |
|---|---|---|
| Recent close | 25,962.73 | Every scenario in this article starts from the most recent Yahoo Finance close on 2026-05-15. |
| 10-year starting point | 20,794.37 | Anchors the long-run compounding math rather than assuming a straight line from the last rally. |
| 10-year price CAGR | 2.25% | Shows that HSI has been a low-compounding but highly cyclical index over the last decade. |
| 10-year range | 14,687.02 to 32,887.27 | Defines realistic historical boundaries for bullish and bearish scenario work. |
| Recent 1-month range | 25,679.78 to 26,626.28 | Captures the current trading regime and the market's near-term volatility. |
| Fact | Latest public evidence | Interpretation |
|---|---|---|
| Constituent count | 90 stocks | The benchmark is broader than the old 50-stock HSI, which changes sector balance and stock-specific concentration. |
| Total market value | HK$30.94 trillion | The HSI still captures the core investable Hong Kong blue-chip complex. |
| Market-cap coverage | 64.26% | The index remains the clearest public barometer for the HKEX main-board large-cap market. |
| Dividend yield | 3.04% | Income still matters in total-return math, even if the price chart looks unimpressive. |
| P/E ratio | 14.08x | Valuation is not distressed in the absolute sense, but it remains below many developed-market growth benchmarks. |
| Composition signal | Official review evidence | Forecast implication |
|---|---|---|
| Hong Kong companies | 23 names, 26.83% weight after the February 2026 review | Local banks, insurers, developers, and utilities still matter, but they no longer dominate the whole benchmark. |
| Mainland-related companies | 67 names, about 73% combined weight across H-shares, red chips, and other mainland companies | Mainland growth, regulation, and sentiment remain the biggest index-level drivers. |
| Top weights | HSBC 8.26%, Alibaba 7.48%, Tencent 7.33%, AIA 5.51% | The HSI is simultaneously a financials index, a China internet index, and a Hong Kong confidence barometer. |
The official HSI factsheet and February 2026 review materials show why. The benchmark now has 90 constituents, a 3.04% indicated dividend yield, a 14.08x P/E ratio, and a weight structure where Hong Kong names represent only 26.83% after the latest review while mainland-related companies make up the balance. That mix means the HSI depends on Hong Kong as a financial hub, but it also depends heavily on China's earnings cycle, internet-platform regulation, southbound flow momentum, and the durability of offshore-fundraising demand. Investors who treat it as only a Hong Kong property or bank proxy usually miss the bigger picture.
03. Main Drivers
What matters more for 2027 than for 2035
1. Earnings revisions will matter more than grand strategy
For 2027, investors will judge the HSI mostly on whether heavyweight constituents keep revising earnings higher. J.P. Morgan Asset Management expects MSCI China EPS growth to improve in 2026 and remain strong in 2027, especially for tech. If that view proves right, the HSI can extend gains. If earnings roll over, the near-term case weakens quickly.
2. The U.S. rate path still matters because of the currency peg
Hong Kong does not run an independent free-floating-rate regime. Tighter global financial conditions still feed directly into local liquidity. That is why near-term HSI upside can be capped even when mainland earnings improve.
3. Stock Connect flow trends can move faster than fundamentals
Official HKEX Q1 2026 data showed record cross-border activity. In the near term, those flows can amplify rallies or drawdowns. For 2027, liquidity and sentiment can matter almost as much as economic logic.
4. Property stress is a nearer-term confidence variable
A decade article can afford to assume eventual normalization. A 2027 article cannot. Office vacancies, collateral values, and commercial-property sentiment can influence banks, listed landlords, and risk appetite much faster than longer-term structural stories.
| Variable | Why it matters now | Bias |
|---|---|---|
| China tech earnings | Heavyweight index constituents are highly sensitive to revisions | Constructive |
| U.S. and HK rates | Funding conditions can tighten quickly under the peg | Neutral to bearish |
| Stock Connect flows | Liquidity can move the market faster than macro data | Constructive |
| CRE sentiment | Local confidence can deteriorate quickly if the office market worsens again | Bearish |
04. Institutional Forecasts and Analyst Views
Public institutional material still leans constructive, but not unambiguously
The institutional message for 2027 is that China and Hong Kong equities can keep recovering, but the path depends heavily on earnings and policy follow-through. Invesco argues 2026 could mark the year when global investors start rebuilding exposure to Chinese equities and the RMB. J.P. Morgan AM is modestly positive on China with a stronger earnings outlook. At the same time, the IMF highlights trade fragmentation, higher global rates, market volatility, and CRE vulnerability. Analysts remain divided on speed, but less divided on the fact that 2027 is still a scenario market rather than a certainty market.
| Source | Main signal | 2027 implication |
|---|---|---|
| IMF | Recovery continues, but risks remain elevated | Supports cautious optimism. |
| Invesco | Re-engagement with Chinese equities could build further | Supports upside through flows and rerating. |
| J.P. Morgan AM | Earnings-led China story still has room | Supports the bull and base cases. |
| HKEX | Capital-market activity and Stock Connect are strong | Supports market-function and liquidity assumptions. |
05. Bull, Bear, and Base Cases
A near-term HSI forecast should be tactical and scenario based
Bullish scenario
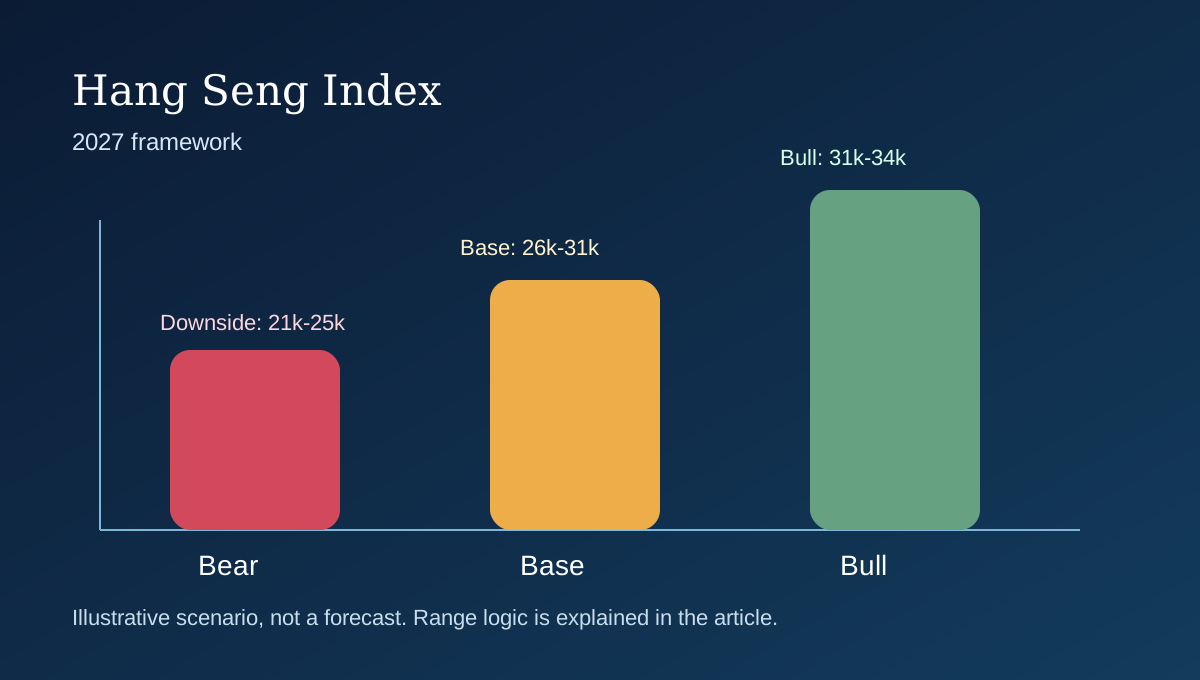
The bull case is 31,000 to 34,000 by 2027. This requires further earnings upgrades in China tech and financials, supportive southbound flows, and a macro backdrop that does not re-tighten sharply through the Hong Kong peg.
Base-case scenario
The base case is 26,000 to 31,000. It assumes the recovery stays alive but choppy, with some valuation support and some earnings progress offset by periodic geopolitical or policy shocks.
Bearish scenario
The bear case is 21,000 to 25,000. That would likely require weaker earnings, fading liquidity support, or a renewed shock from global rates or local property stress.
| Scenario | Range | Conditions | Probability |
|---|---|---|---|
| Bull | 31,000-34,000 | EPS upgrades and stronger risk appetite | 25% |
| Base | 26,000-31,000 | Uneven but positive recovery | 45% |
| Bear | 21,000-25,000 | Macro tightening or renewed derating | 30% |
| Path | Estimated probability | Why |
|---|---|---|
| Rising from current levels by 2027 | 45% | Recovery and earnings support remain present, though not overwhelming. |
| Falling below current levels by 2027 | 30% | Near-term downside remains credible because the HSI is still highly macro sensitive. |
| Moving broadly sideways | 25% | Still plausible if sentiment improves but valuation rerating stalls. |
Risks to watch
For 2027, investors should watch earnings revisions, HIBOR and Fed expectations, commercial real estate headlines, and cross-border flow momentum more closely than distant structural plans.
What could invalidate this forecast
This framework would be too bearish if earnings breadth improves faster than expected and the market starts rewarding Hong Kong as a capital-market recovery story. It would be too bullish if the next liquidity or geopolitics shock arrives before earnings can do the heavy lifting.
Conclusion
The cleanest 2027 HSI view is tactical and conditional: upside is still plausible, but it is unlikely to be smooth or conviction-free.
Disclaimer: This article is for research and informational purposes only. Near-term ranges and tactical positioning ideas are conditional estimates, not personalized advice.
06. Investor Positioning
Different readers should respond to the same forecast in different ways
| Investor profile | Cautious approach | What to monitor |
|---|---|---|
| Investor already in profit | Hold a core position but consider trimming into strength if the move is running well ahead of earnings revisions. | Southbound flow momentum, EPS revisions, and whether the rally broadens beyond a few heavyweights. |
| Investor currently at a loss | Avoid averaging down automatically; first decide whether the original thesis was valuation mean reversion, income, China tech recovery, or Hong Kong reopening. | Policy follow-through, index breadth, and whether downside is cyclical or structural. |
| Investor with no position | Use staggered entries or wait for pullbacks instead of chasing breakouts after sentiment spikes. | Valuation discipline, U.S. rate path, and cross-border flow data. |
| Trader | Use stop-loss discipline and treat HSI as a macro-sensitive trading instrument rather than a low-volatility income index. | Geopolitics, earnings season, and U.S.-China rate and policy headlines. |
| Long-term investor | Dollar-cost averaging is more defensible than heroic point forecasting, but only if the portfolio can tolerate multi-year drawdowns. | Dividend resilience, structural earnings mix, and capital-market reforms. |
| Risk-hedging investor | Rebalance or hedge if Hong Kong and China exposure is already large elsewhere in the portfolio. | Correlation spikes, USD strength, and commercial real estate stress. |
07. FAQ
Common questions investors ask about this HSI outlook
Why is the 2027 range narrower than the 2035 range?
Because a two-year forecast is more constrained by current valuation, recent price action, and visible earnings revisions, while a decade forecast allows for bigger regime changes.
What is the biggest near-term swing factor?
Probably the combination of China tech earnings revisions and liquidity conditions under the Hong Kong dollar peg.
Can the HSI rise even if Hong Kong offices stay weak?
Yes, for a while. But persistent office-market weakness can still cap local sentiment and hurt parts of the financial and property complex.
08. Sources
Primary and high-credibility references used in this article
- Yahoo Finance chart API for ^HSI, 10-year monthly history
- Yahoo Finance chart API for ^HSI, recent daily closes
- Hang Seng Index factsheet, data as at April 30, 2026
- Hang Seng Indexes Company February 2026 index review results
- HKEX Monthly Market Highlights, April 2026
- HKEX Q1 2026 Hong Kong Market Update
- HKEX Stock Connect 2025 Review
- HKEX 2025 annual results presentation
- IMF staff concluding statement for Hong Kong SAR, May 15, 2026
- Hong Kong 2026-27 Budget speech, economic outlook section
- Hong Kong advance GDP estimates for Q1 2026
- Hong Kong retail sales statistics for March 2026
- HKMA Half-Yearly Monetary and Financial Stability Report, March 2026
- Hong Kong Property Review 2026 preliminary findings
- Invesco 2026 investment outlook for Chinese equities
- Invesco China outlook for 2026
- UBS China Outlook 2026-27: Resilience and Rebalancing
- Goldman Sachs view on China's 2026 growth outlook
- J.P. Morgan Asset Management global ex-US equities outlook, China section