01. Quick Answer
Natural gas has a credible 2030 upside path, but the defensible forecast is a range centered above today's price rather than a one-number call
NYMEX natural gas futures settled at about $3.04/MMBtu on May 18, 2026 on the Yahoo Finance chart API, NG=F 1-month daily data, while EIA's official monthly Henry Hub benchmark averaged $2.77/MMBtu in April 2026 according to the EIA, Short-Term Energy Outlook: Natural gas, May 12, 2026. That split matters. Futures reflect the market's latest expectations and risk premium, while the Henry Hub cash benchmark is the cleaner official anchor for medium-term scenario work.
Over the last decade, the same benchmark has traded from a 10-year low near $1.43/MMBtu in June 2020 to a 10-year high near $10.03/MMBtu in August 2022 based on the Yahoo Finance chart API, NG=F 10-year monthly data. That range is why any serious natural gas forecast needs regimes and probabilities, not a single heroic target.
The official near-term picture is unusually fluid. In January 2026, EIA said Henry Hub could average just under $4.60/MMBtu in 2027 because LNG feedgas demand would start to outrun supply growth in the EIA, We expect Henry Hub natural gas spot prices to fall slightly in 2026 before rising in 2027, January 14, 2026. By May 12, 2026, the same agency had revised its base case to $3.18/MMBtu for 2027 after lifting associated gas output assumptions in the Permian in the EIA, Short-Term Energy Outlook: Natural gas, May 12, 2026. That revision is not noise. It is a reminder that natural gas pricing remains highly sensitive to production assumptions, infrastructure timing, and the global LNG backdrop.
For the 2030s, EIA's EIA, Annual Energy Outlook 2026 year-by-year data workbook shows a counterfactual baseline Henry Hub path of about $4.48/MMBtu in 2030 and $5.05/MMBtu in 2035 in real 2025 dollars, while the EIA, Annual Energy Outlook 2026 narrative PDF says prices remain between roughly $5 and $6/MMBtu through the early 2030s in most cases. Those are not guarantees, but they provide a useful institutional center of gravity for long-range scenario building.
| Category | Evidence-based read | Implication |
|---|---|---|
| Historical data | The 10-year band runs from about $1.43 to $10.03/MMBtu based on Yahoo monthly data. | Natural gas has extreme cyclicality; point forecasts need wide error bars. |
| Current market conditions | Futures near $3.04 and April Henry Hub cash near $2.77 imply a market that has normalized from winter spikes but is not structurally cheap. | The current level is a neutral-to-slightly constructive starting point, not a panic low. |
| Institutional forecasts | EIA's May 2026 STEO is softer on 2027, while AEO 2026 is firmer for the early 2030s. | Near-term oversupply does not automatically invalidate a higher 2030s path. |
| Main swing factors | LNG exports, associated gas, weather, data-center power demand, and global supply security still dominate. | Forecast confidence should rise or fall with these variables, not with narrative alone. |
02. Historical Context
The last decade shows why 2030 forecasts should be built from regimes, not straight-line trend extrapolation
Over the last decade, the same benchmark has traded from a 10-year low near $1.43/MMBtu in June 2020 to a 10-year high near $10.03/MMBtu in August 2022 based on the Yahoo Finance chart API, NG=F 10-year monthly data. That range is why any serious natural gas forecast needs regimes and probabilities, not a single heroic target. That arc includes a pandemic glut, a European energy shock, a warm-weather washout, and a renewed winter squeeze. In other words, gas is not a simple mean-reverting utility input. It is a weather-sensitive, storage-sensitive, infrastructure-sensitive commodity that now sits inside a global LNG system.
The medium-term lesson is that the 2020 low and the 2022 high were both real, but neither was durable equilibrium. The market spends most of its time between those extremes. For 2030, the right question is whether Henry Hub settles into a structurally higher band because LNG exports, power demand, and global security concerns tighten the market more often than they did in the 2010s.
| Marker | Approximate level | Interpretation |
|---|---|---|
| June 2020 low | $1.43/MMBtu | Pandemic-era demand destruction and oversupply showed how quickly gas can break when storage and weather turn against bulls. |
| August 2022 high | $10.03/MMBtu | The European energy crisis and LNG-linked scarcity proved that U.S. gas is no longer insulated from global stress. |
| March 2024 low close | $1.76/MMBtu | Warm weather, strong output, and ample inventories can still push the market back toward sub-$2 conditions. |
| January 2026 spike | $7.83 intramonth high | Short-term squeezes remain possible when winter weather, storage withdrawals, and export utilization line up. |
| May 18, 2026 close | $3.04/MMBtu | The latest tape sits near the middle of the long-run range, which is why scenarios matter more than momentum extrapolation. |
03. Main Drivers
Five forces matter most for a 2030 natural gas price outlook
1. LNG export growth keeps pulling U.S. gas into a global market
EIA, U.S. natural gas exports to grow nearly 30% by 2027 as LNG facilities ramp up, April 17, 2026 says U.S. LNG exports should average 17.0 Bcf/d in 2026 and 18.2 Bcf/d in 2027 as new capacity ramps. The Shell LNG Outlook 2025 press release also argues that LNG demand can rise by around 60% by 2040. If that longer-run demand path broadly holds, Henry Hub should trade with a larger global premium than it did before the U.S. became the marginal LNG supplier.
2. Associated gas can cap rallies when oil is strong
The bearish offset comes from the supply side. The EIA, Short-Term Energy Outlook: Natural gas, May 12, 2026 explicitly attributes its softer 2027 call to stronger associated gas output from oil-focused basins, especially the Permian. That matters because gas can become more abundant even when dry-gas producers remain disciplined.
3. Data-center power demand can lift gas burn
The EIA press release, strongest four-year growth in U.S. electricity demand since 2000, fueled by data centers, January 13, 2026 forecasts the strongest four-year growth in U.S. electricity demand since 2000, driven largely by data centers, while the IEA, Energy and AI: Energy supply for AI says natural gas and coal together may meet more than 40% of additional data-center electricity demand through 2030. That does not guarantee a structural gas shortage, but it does support a higher power-sector floor for demand.
4. The global LNG easing wave is no longer as clean as it looked earlier in 2026
The IEA, Gas Market Report Q1 2026 executive summary initially framed 2026 as the start of a stronger LNG supply wave. By Q2, the IEA, Gas Market Report Q2 2026 executive summary said Middle East disruption had delayed the easing effect by at least two years. That is important because a delayed LNG wave supports higher international prices and better U.S. export economics deeper into the decade.
5. Macro growth still matters more than many commodity narratives admit
The IMF, World Economic Outlook, April 2026 and World Bank, Commodity Markets Outlook, April 2026 both point to slower and more shock-prone global growth than the pre-pandemic norm. If industrial activity stays soft, natural gas demand may underperform the most bullish LNG narratives. Available data suggests the market needs both export growth and resilient macro demand to sustain a higher 2030 band.
| Driver | What the latest evidence suggests | Why it matters for price |
|---|---|---|
| LNG exports | EIA expects U.S. LNG exports to rise from 15.1 Bcf/d in 2025 to 17.0 in 2026 and 18.2 in 2027. | Higher export capacity links Henry Hub more tightly to global gas balances. |
| Associated gas | May 2026 STEO assumes more oil-linked gas output from the Permian than earlier forecasts did. | If oil stays firm, gas supply can grow even without a gas-drilling boom. |
| Storage | EIA estimated March-end inventories at 1,908 Bcf, around 4% above the five-year average. | Storage direction affects whether winter risk premium can stick. |
| Global LNG security | IEA says Middle East disruption has delayed the LNG easing wave by at least two years. | International tightness can still pull U.S. gas prices higher through arbitrage and export utilization. |
| Power demand and AI | EIA and IEA both point to data centers as a meaningful electricity-demand driver through 2027 and beyond. | Natural gas remains one of the fastest scalable firm-power options in many U.S. regions. |
04. Institutional Forecasts and Analyst Views
Official forecasts are more constructive for the 2030s than for 2027, but they still argue for conditional thinking
The institutional pattern is coherent even when the headlines are noisy. The EIA, Short-Term Energy Outlook: Natural gas, May 12, 2026 sees Henry Hub at $3.50 in 2026 and $3.18 in 2027, reflecting near-term supply comfort. But the EIA, Annual Energy Outlook 2026 year-by-year data workbook moves the long-run path higher, with Henry Hub around $4.48 in 2030 and $5.05 in 2035 in real 2025 dollars. The EIA, Domestic and international demand drive natural gas production growth, April 8, 2026 also shows U.S. dry gas output rising to serve both domestic demand and LNG exports for decades.
Outside EIA, the IEA, Gas Market Report Q2 2026 executive summary argues that the expected LNG wave has been pushed back, while the TD Economics, Commodities Quick Take, May 2026 and American Gas Association, Natural Gas Market Indicators, May 15, 2026 both frame the market as more balanced than outright bearish. Analysts remain divided mostly on timing, not on whether gas still matters. The real disagreement is whether abundant associated gas offsets LNG and power demand for long enough to keep the early 2030s below the AEO path.
| Source | Forecast or message | Interpretation |
|---|---|---|
| EIA STEO | Henry Hub averages $3.50 in 2026 and $3.18 in 2027. | Near-term balance looks comfortable if associated gas stays strong. |
| EIA January 2026 STEO commentary | 2027 could approach $4.60 when LNG feedgas growth outruns supply. | The upside case is still visible when export growth dominates. |
| EIA AEO 2026 | Henry Hub baseline rises to roughly $4.48 in 2030 and $5.05 in 2035. | Long-range official modeling still leans above today's spot. |
| IEA Gas Market Report Q2 2026 | The LNG easing wave is delayed by at least two years. | Global scarcity can keep U.S. gas more sensitive to overseas shocks. |
| Shell LNG Outlook | Global LNG demand can rise materially into 2040. | Long-run export demand remains a structural support variable. |
05. Bull, Bear, and Base Case
How the 2030 range is built and what could invalidate it
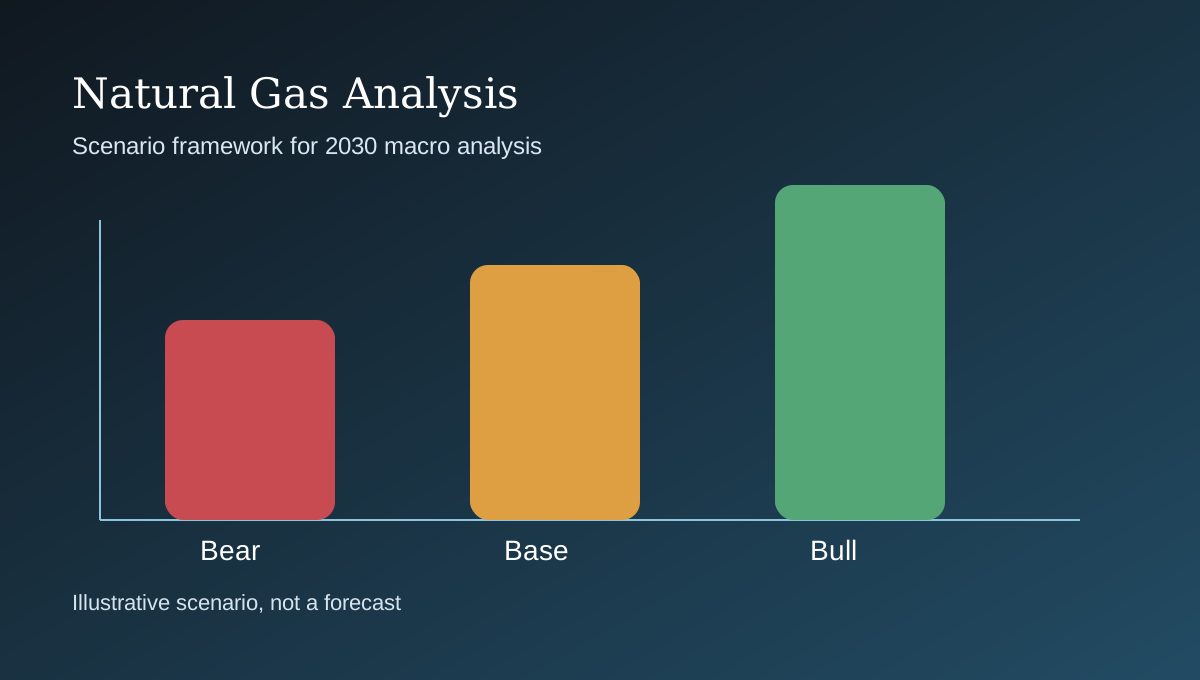
The range below is editorial, not an institutional point target. It starts from today's roughly $3.04 futures level, incorporates EIA's lower 2027 base case, then weights the early-2030s AEO path and the global LNG uncertainty described by IEA. That process leads to a higher long-run center than the current market implies, but not to a one-way bull story.
| Scenario | Price range | Conditions | Probability |
|---|---|---|---|
| Bear | $2.50-$3.75/MMBtu | Associated gas remains abundant, winters are mild, renewables curb gas burn, and LNG supply normalizes faster than expected. | 25% |
| Base | $4.00-$5.25/MMBtu | Exports rise, power demand increases, but supply also grows enough to avoid chronic scarcity. | 45% |
| Bull | $5.50-$7.50/MMBtu | LNG tightness persists, AI-related power demand accelerates, weather turns more volatile, and supply growth disappoints. | 30% |
| Direction | Probability | Comment |
|---|---|---|
| Probability of rising from today's level | 55% | The long-run official baseline sits above current futures, which gives the upside a modest edge. |
| Probability of falling from today's level | 20% | A lower regime is still possible if oversupply and mild weather dominate for years. |
| Probability of moving sideways in a broad range | 25% | Gas often spends long stretches oscillating without a durable trend. |
| Investor type | Prudent approach | Main watchpoints |
|---|---|---|
| Investor already in profit | Hold a core position if the thesis still depends on LNG growth or higher structural demand, but trim into sharp weather-driven spikes. | Watch whether rallies are backed by storage draws and export strength or only by short-covering. |
| Investor currently at a loss | Re-underwrite the thesis before averaging. A commodity can be right long term and still punish poor entries. | Separate structural LNG demand from short-term weather trades. |
| Investor with no position | Avoid chasing vertical moves. Wait for pullbacks, scale in gradually, or stay out when risk-reward is asymmetric. | Natural gas often offers better entries after volatility rather than during it. |
| Trader | Use stop-losses, respect seasonality, and follow storage, weather, production, and LNG feedgas daily. | Fast price moves can reverse before a macro thesis has time to play out. |
| Long-term investor | Dollar-cost averaging can work only with small sizing and a clear tolerance for drawdowns. | A cyclical energy asset should not be sized like a stable compounder. |
| Risk-hedging investor | Use natural gas as part of a broader inflation or energy-security hedge basket, then rebalance when the hedge becomes a crowded directional bet. | Gas can diversify some macro risks while creating weather and policy risk of its own. |
| Invalidation trigger | Why it matters | What it would change |
|---|---|---|
| Persistent sub-$3 cash prices despite export growth | Would imply supply elasticity is much stronger than this framework assumes. | The base case would shift lower and the bull case would lose credibility. |
| A much faster LNG supply build than IEA currently assumes | Would reduce global scarcity and narrow export arbitrage. | The 2030 range would likely compress closer to $3-$5. |
| Data-center demand fails to translate into gas-fired generation | Would weaken the AI-linked power-demand thesis. | The bull case would depend mostly on weather and geopolitics rather than structural demand. |
The balanced conclusion is that natural gas in 2030 probably trades above today's subdued expectations, but the evidence is mixed on whether it deserves a permanently high-single-digit regime. Disclaimer: This article is for research and informational purposes only and is not personalized financial advice.
06. FAQ
Frequently asked questions
What is the most credible natural gas forecast for 2030 right now?
A cautious base case is roughly $4.00 to $5.25/MMBtu, because it sits above today's market but remains close to EIA's broader early-2030s framework.
Why not just use today's price as the forecast anchor?
Because natural gas is highly seasonal and event-driven. Current futures say more about near-term storage and weather than about 2030 equilibrium.
What is the strongest bullish argument?
The strongest bull case combines LNG growth, delayed global supply easing, and AI-related power demand that keeps gas generation more durable than expected.
What is the strongest bearish argument?
The strongest bear case is abundant associated gas plus fast renewable deployment and repeated mild winters, which would cap U.S. gas demand and refill storage easily.
References
Sources
- Yahoo Finance chart API, NG=F 10-year monthly data
- Yahoo Finance chart API, NG=F 1-month daily data
- EIA, Short-Term Energy Outlook: Natural gas, May 12, 2026
- EIA, We expect Henry Hub natural gas spot prices to fall slightly in 2026 before rising in 2027, January 14, 2026
- EIA, Domestic and international demand drive natural gas production growth, April 8, 2026
- EIA, U.S. natural gas exports to grow nearly 30% by 2027 as LNG facilities ramp up, April 17, 2026
- EIA press release, strongest four-year growth in U.S. electricity demand since 2000, fueled by data centers, January 13, 2026
- EIA, Annual Energy Outlook 2026 narrative PDF
- EIA, Annual Energy Outlook 2026 year-by-year data workbook
- IEA, Gas Market Report Q1 2026 executive summary
- IEA, Gas Market Report Q2 2026 executive summary
- IEA, Energy and AI: Energy supply for AI
- World Bank, Commodity Markets Outlook, April 2026
- IMF, World Economic Outlook, April 2026
- Shell LNG Outlook 2025 press release