01. Quick Answer
A 2030 Sensex forecast works better as a range than as a single number
Available data suggests the Sensex still has a credible long-run upside path into 2030, but the most defensible framework is a conditional range rather than a precise target. A reasonable base case sits around 95,000 to 110,000 by 2030 if India sustains above-peer real growth, large-cap earnings compound in the high-single-digit to low-double-digit range, and the market avoids another major valuation overshoot.
The evidence is mixed on a more aggressive outcome because the benchmark is not cheap, its top weights remain concentrated, and India's macro sensitivity to imported energy has not disappeared. That is why the right question is not whether India is a structural growth story. It is whether today's valuation and sector mix leave enough room for that story to translate into solid future returns.
- Historical data supports a constructive long-run view, but not a straight-line rally.
- Current market conditions show resilience, yet Sensex concentration makes breadth important.
- Institutional forecasts are strongest over 12 to 24 months, so longer targets should stay scenario-based.
- Bull, bear, and base cases depend on earnings growth, domestic flows, oil, and valuation discipline.
02. Current Market Snapshot
A Sensex outlook needs a current anchor before it can become a forecast
As of May 15, 2026, the Sensex closed near 75,237.99, according to Yahoo Finance chart data[1]. That leaves the benchmark below its 52-week high of 86,159.02 but above the 52-week low of 71,545.81[2]. The market is therefore not washed out, but neither is it trading at the euphoric high reached in late 2025.
History also matters here. Over the past decade, monthly closes moved from about 26,999.72 in late May 2016 to 75,237.99 in mid-May 2026, a roughly 10.79% annualized gain[1]. The BSE's 40-year paper adds a longer lens: it notes about 13.4% annualized Sensex growth over 39 years, in line with nominal GDP growth, while also emphasizing that sector leadership has changed materially over time[5].
| Metric | Value | Why it matters |
|---|---|---|
| Recent close | 75,237.99 on May 15, 2026 | Starting point for all scenario work |
| 10-year range | 26,626.46 to 85,706.67 | Shows how much India's large-cap benchmark has already repriced |
| 10-year CAGR | 10.79% | Useful reality check against aggressive long-run projections |
| 1-year high / low | 86,159.02 / 71,545.81 | Captures the 2025 peak and the 2026 stress window |
| Deepest 10-year drawdown | -38.07% | Helps separate a correction from a true bear market |
| Structural concentration | Top 10 names about 65% of index weight | Leadership breadth matters more than headline GDP alone |
The other reason current structure matters is concentration. According to the BSE Sensex at 40 paper, financial-services weight nearly doubled from about 22% in 2005 to roughly 39.5% in 2025, and the top 10 names represent about 65% of the benchmark's weight[5]. That means the headline market story can look healthy even when leadership is narrower than many investors assume.
03. Historical Context And Main Drivers
The 2030 outlook depends on growth quality, liquidity, and sector breadth
Sensex behavior over the last decade already shows why forecast language has to stay disciplined. The daily series implies a maximum drawdown of roughly -38.07%, from 41,952.63 on January 14, 2020 to 25,981.24 on March 23, 2020[2]. That was a genuine crisis drawdown, not a routine correction. Distinguishing correction, bear market, and crash is not semantics; it changes how investors should interpret risk.
| Driver | Current evidence | Bullish implication | Bearish implication |
|---|---|---|---|
| Nominal GDP and domestic demand | IMF and World Bank still frame India as a leading growth engine | Supports revenue growth across banks, industrials, telecom, and consumption | A broader slowdown would hit more than just cyclical pockets |
| Domestic fund flows | AMFI still reports more than Rs 31,000 crore monthly SIP inflows | Local liquidity can cushion foreign selling | If flows cool while valuations stay rich, corrections can deepen |
| Oil and imported inflation | World Bank and current broker notes keep flagging energy risk | Benign oil helps margins, inflation, and rates | High oil can pressure earnings and the external balance together |
| Financials concentration | BSE research shows financials near 39.5% of the index | Healthy credit and asset quality can lift the whole benchmark | A banking wobble can transmit weakness broadly |
| Productivity and capex | IMF and Invesco still see scope for stronger investment and earnings growth | Wider leadership can make the rally more durable | If capex stays narrow, upside remains concentrated |
The macro backdrop remains constructive, though not risk-free. The World Bank's April 2026 India Development Update still describes India as one of the fastest-growing major economies, even while warning that higher energy prices and conflict-related disruption could soften activity[8]. The IMF's Article IV material is similarly constructive on medium-term potential, while still flagging fragmentation and external vulnerabilities[6][7].
Domestic liquidity is the second crucial support. AMFI reported April 2026 SIP contributions of Rs 31,115 crore, which means local households still provide a recurring equity bid even when foreign investors wobble[9]. That does not eliminate downside risk, but it does change market mechanics. A benchmark supported by recurring domestic savings can absorb volatility differently from one that relies heavily on external flows alone.
04. Institutional Forecasts And Analyst Views
Institutional calls help anchor the path even when they stop short of 2030
There is a practical limit to what institutional forecasts can tell investors beyond one or two years. Most sell-side houses publish 12-month targets, not clean 2030 or 2035 endpoints. That means any longer-horizon Sensex estimate should be treated as a scenario framework built from current valuation, earnings assumptions, macro conditions, and credible institutional anchors rather than as a precise consensus number[10][11][12][13].
| Source | Target / stance | Core thesis | What it signals |
|---|---|---|---|
| HSBC | 94,000 by end-2026 | Valuations improved and domestic macro conditions looked more supportive | Bullish near-term anchor, but not a guarantee of straight-line upside |
| J.P.Morgan | Neutral on India; earnings and oil risks highlighted | Valuation premium and oil-led stress can cap returns | Useful reminder that strong macros do not erase entry risk |
| Morgan Stanley | 95,000 base case and 107,000 bull case for 2026 | Macro stability plus private investment can restart leadership | Constructive for the medium-term path if reforms persist |
| Invesco | Constructive 2026 India equities outlook | Resilient macro backdrop, improving valuations, and data-center or telecom upside | Supports the case for better earnings breadth rather than pure multiple expansion |
For a 2030 article, the practical takeaway from current broker material is not the exact 2026 target. It is that major houses are still debating the same variables that will matter in 2030: earnings breadth, oil sensitivity, valuations, financial conditions, and whether domestic capital formation can outlast global turbulence.
My 2030 range is built on that framework. If Sensex earnings can compound around 9% to 11% annually and the market trades in a disciplined valuation band rather than re-rating aggressively, a 95,000 to 110,000 base range is reasonable. A more aggressive bull case requires both stronger profits and better breadth. A true bear case likely needs either persistent oil stress, weaker financial earnings, or a meaningful de-rating of India's premium.
05. Bullish Scenario
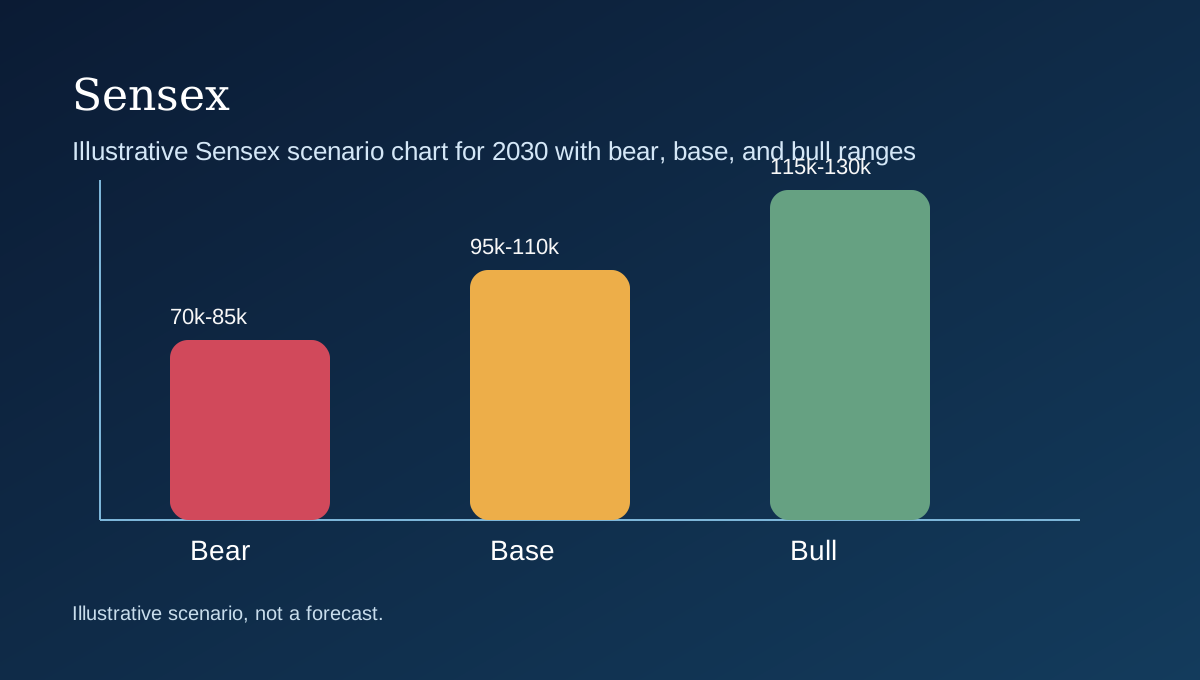
What could push the Sensex toward 115,000 to 130,000 by 2030
A credible bull case starts with profit durability rather than with sentiment alone. If public capex continues to crowd in private investment, if banks preserve healthy balance sheets, and if inflation stays manageable enough to keep financial conditions supportive, index earnings could compound faster than cautious investors expect.
The upside case improves further if leadership broadens beyond banks and a few mega caps. Sensex exposure to consumer discretionary, telecom, industrials, and digital infrastructure can matter more if India's growth engine becomes less narrow. Under that combination, the index could trade in the upper half of its historical valuation range and justify a 115,000 to 130,000 path by 2030.
06. Bearish Scenario
What could instead keep the Sensex stuck in a 70,000 to 85,000 range
The most obvious bear trigger is a prolonged energy shock. The World Bank explicitly warned that conflict-driven oil pressure could weigh on India through imported inflation, weaker margins, and slower activity. If crude stays elevated long enough to squeeze both consumers and corporates, the Sensex could face simultaneous earnings downgrades and multiple compression.
A second bearish path is slower earnings without a full macro crisis. A premium market can generate poor five-year returns simply because earnings underdeliver while valuations normalize. In other words, India does not need to break for the Sensex to disappoint. It only needs the market to stop paying a rich price for a good story.
07. Base Case
Why 95,000 to 110,000 remains the most defensible 2030 range
The base case assumes India remains a structurally above-average grower, but not an exception to valuation gravity. Available official data still point to resilient growth, manageable inflation relative to past stress episodes, and strong domestic financialization. Under that backdrop, high-single-digit to low-double-digit earnings compounding is more plausible than either a dramatic acceleration or a collapse.
From roughly 75,000 today, a 95,000 to 110,000 range by 2030 would imply respectable returns without assuming a speculative melt-up. It also aligns better with the benchmark's 10-year CAGR than the more heroic forecasts that quietly assume permanently higher valuations and flawless execution.
08. Probability Framework And Investor Positioning
Probability table and positioning by investor type
The probabilities below are judgment calls, not objective odds. They combine the starting valuation, the Sensex's concentration, official macro material, domestic flow data, and current institutional notes. The point is to show how a forecast range is built rather than to pretend precision where none exists.
| Path | Probability | Conditions |
|---|---|---|
| Rising toward 95k-130k by 2030 | 55% | Requires sustained earnings growth, stable domestic inflows, and no prolonged oil shock |
| Falling toward 70k-85k | 20% | Would likely need persistent earnings downgrades and deeper multiple compression |
| Mostly sideways / range-bound | 25% | Possible if earnings grow but valuation normalizes at the same time |
| Investor profile | Prudent approach | Why that stance fits |
|---|---|---|
| Investor already in profit | Hold core, trim weak positions, rebalance on strength | Protect gains without treating every rally as permanent |
| Investor currently at a loss | Avoid panic selling; review thesis, stagger exits or adds | Entry price risk is different from broken market structure |
| Investor with no position | Wait for pullbacks or use staged dollar-cost averaging | A full-size entry into a premium market raises regret risk |
| Trader | Use stop-loss rules and respect oil, rupee, and earnings catalysts | Short-term price action can diverge sharply from the macro story |
| Long-term investor | Accumulate selectively and rebalance sector concentration | Time horizon helps only if sizing stays disciplined |
| Hedger / risk-only investor | Use partial hedges, avoid overpaying for tail risk | India has macro risk, but not every risk deserves an extreme hedge |
For most readers, the practical implication is the same across themes: avoid treating a structural India story as a license to chase price. The benchmark can remain attractive over the long run while still being vulnerable to valuation resets, oil shocks, and leadership rotations.
09. Risks To Watch And What Could Invalidate The Forecast
Oil, valuations, and earnings breadth matter more than slogans
The risks to watch are unusually concrete: energy prices, inflation reacceleration, a cooling of domestic fund flows, and any meaningful slowdown in large-cap earnings breadth. None of those risks require an India-specific crisis. They only require investors to stop assuming that macro resilience automatically protects valuations.
What would invalidate this article's base case? Either direction can do it. A more durable productivity and capex surge could make 95,000 to 110,000 too conservative. On the other hand, a longer oil shock combined with weaker financial earnings and premium compression could make it too optimistic.
| Signal | Why it matters | Implication for the thesis |
|---|---|---|
| Oil remains benign and earnings accelerate above expectations | Would improve margins, inflation, and sentiment together | The base case would likely prove too low |
| Domestic SIP flows slow materially while foreign selling rises | A thinner local bid would expose valuation risk | The bear case would gain probability |
| Financials lose earnings leadership | The index is heavily dependent on banks and lenders | A sector-specific issue could hit the full benchmark |
Disclaimer: This article is editorial scenario analysis, not personalized financial advice. Forecast ranges are conditional and can fail if earnings, policy, liquidity, inflation, or geopolitics move materially away from current assumptions.
10. Conclusion
The 2030 Sensex outlook is constructive, but only in a disciplined framework
A realistic Sensex prediction for 2030 is neither a crash call nor a fairy tale. Historical data, official macro assessments, and persistent domestic flows all support a constructive long-run outlook for Indian equities. But the evidence is mixed on any single heroic number because the benchmark is not cheap and India remains sensitive to oil, rates, and earnings breadth. For most investors, the best use of a 2030 forecast is to guide position sizing, rebalancing, and expectations rather than to justify certainty.
FAQ
Frequently asked questions
Can the Sensex realistically clear 100,000 by 2030?
Yes, that is plausible in the base-to-bull range if earnings growth stays solid and valuations do not compress sharply. It should still be treated as a scenario, not a promise.
What is the biggest risk to a bullish Sensex 2030 forecast?
A prolonged oil shock is the clearest macro risk because it can pressure inflation, margins, the rupee, and risk appetite at the same time.
Why use a range instead of one exact target?
Because institutional coverage becomes much weaker beyond one or two years. Scenario ranges are more defensible than false precision.
Does strong SIP money eliminate downside risk?
No. It reduces fragility, but it does not prevent valuation resets or earnings disappointments.
References
Sources
- Yahoo Finance chart data for ^BSESN - 10-year monthly history
- Yahoo Finance chart data for ^BSESN - daily history for drawdowns and 52-week range
- BSE SENSEX official index page
- BSE Indices Methodology
- BSE Sensex at 40 research paper, January 2026
- IMF Executive Board Concludes 2025 Article IV Consultation with India
- IMF Staff Country Report: India 2025 Article IV Consultation
- World Bank India Development Update, April 2026
- AMFI Monthly Note, April 2026
- Reuters via TradingView - HSBC upgrades Indian equities to overweight, sees Sensex at 94,000 by 2026-end
- Reuters via MarketScreener - J.P.Morgan downgrades India equities to neutral on oil-led earnings risks
- Business Standard - Morgan Stanley sees Sensex at 95,000 base case and 107,000 bull case
- Invesco 2026 Outlook - India Equities