01. Quick Answer
A responsible 2035 silver forecast starts by treating current institutional views as waypoints rather than as long-dated precision targets
COMEX silver futures (SI=F on Yahoo Finance) were trading around $75.7/oz on 2026-05-18. The same 10-year monthly series started near $18.6/oz on 2016-06-01 and most recently showed $75.7/oz, with a 10-year range of roughly $14.1 to $78.3 and a price-only CAGR near 17.78% (10-year monthly data).
Very few major institutions publish direct 2035 silver targets. The better method is to use present prices, current bank forecasts, long-run supply-demand trends, and realistic compounding bands to frame what is plausible. That is why the 2026-2027 path from J.P. Morgan and the official LBMA survey average matter so much: they set the starting slope for any credible long-range scenario.
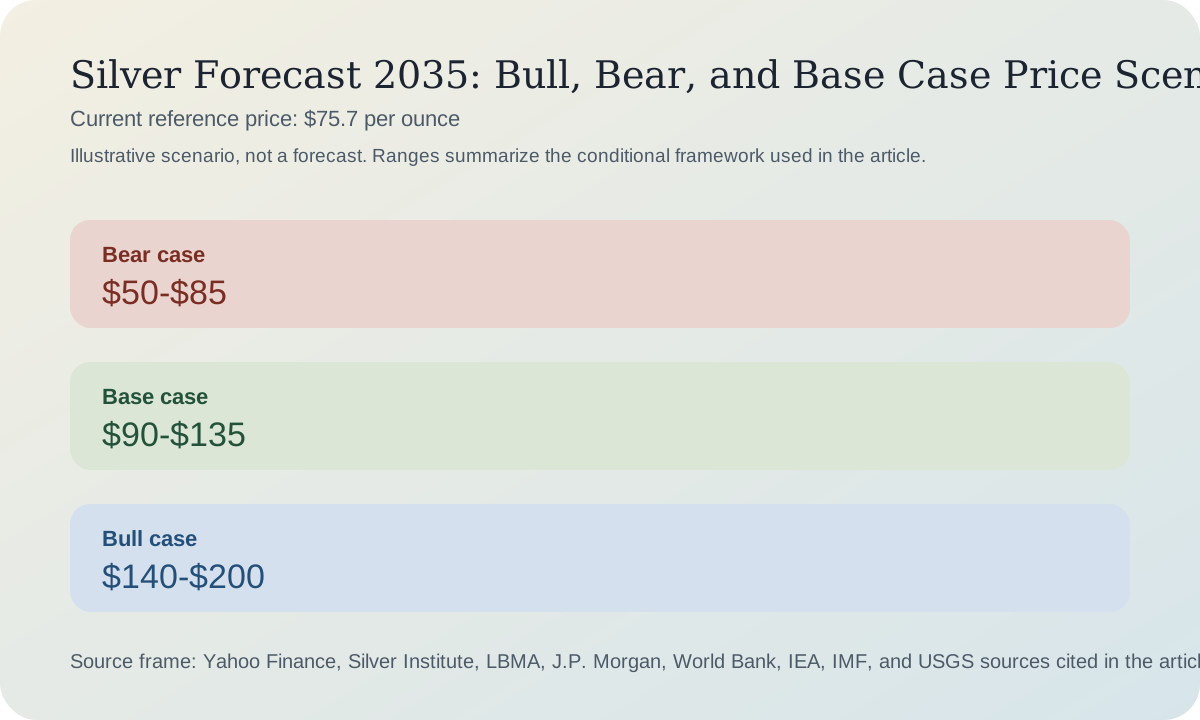
On that basis, a cautious base case sits around $90 to $135 by 2035. A bear case below that range remains plausible if silver's industrial intensity keeps falling and real economic growth weakens demand. A bull case above $140 requires more than ordinary strength; it needs a structural environment where investment demand and industrial demand reinforce one another for years.
| Point | Why it matters |
|---|---|
| Historical data | Silver's long-run path is too volatile for point estimates to be credible on their own. |
| Institutional anchors | J.P. Morgan and LBMA provide useful medium-term markers, but not precise 2035 answers. |
| Scenario discipline | A long-dated base case should be built from realistic return bands and physical-balance assumptions. |
| Risk management | The farther out the horizon, the more the forecast depends on regime choice rather than on current momentum. |
02. Historical Context
Long-dated silver forecasts only become credible when the return assumptions are made visible
From today's level near $75.7, a move to $90 by 2035 requires only modest nominal compounding. A move to $200 requires something much more unusual. That difference matters because silver is not a purely monetary asset. It needs both an industrial and an investment story to sustain the highest-end numbers.
Silver Institute research keeps the long-run bull thesis alive because it shows demand spreading across power grids, data centers, EVs, and advanced electronics, not just solar (technology demand; industrial demand context). But the same research also warns that PV thrift and price sensitivity can blunt the slope of demand growth.
That is why 2035 analysis should be framed around regimes instead of headlines. If the market keeps running deficits and technology demand broadens, higher ranges make sense. If silver becomes easier to substitute or if macro conditions stay hostile to investor flows, the upper-end targets lose credibility very quickly.
| Metric | Latest reading | Why it matters |
|---|---|---|
| Current silver price | $75.7/oz | Every forward-looking range should be anchored to the current futures market, not to an outdated low. |
| 52-week range | $32.1 to $121.3 | Silver has already shown how wide its volatility band can be in a single year. |
| 10-year monthly range | $14.1 to $78.3 | Helps distinguish a normal correction from a structural break in the thesis. |
| 10-year price CAGR | 17.78% | A very high recent CAGR is a warning against straight-line extrapolation. |
| 2026 J.P. Morgan anchor | $81 average | A major-bank reference point for whether today's level already discounts a lot of the bullish story. |
| Editorial base range | $90-$135 | Scenario ranges are more defensible than pretending silver has one inevitable destination. |
| 2035 range | Approx. annualized path | Interpretation |
|---|---|---|
| $50-$85 | About -3.2% to +1.3% | Bearish or low-compounding world with softer industrial intensity and weaker investment demand. |
| $90-$135 | About +1.9% to +6.7% | Moderately constructive long-run base case from a much higher current base. |
| $140-$200 | About +7.2% to +11.4% | Requires a very supportive interaction between physical tightness and macro buying. |
03. Main Drivers
The 2035 range depends on whether five structural debates resolve in silver's favor
1. Does the deficit cycle persist for most of the next decade?
The Silver Institute still sees a sixth straight annual deficit in 2026. If deficits remain frequent rather than exceptional, silver's floor into 2035 should stay much higher than in the 2010s.
2. Do power, grid, and AI-related applications broaden demand enough to offset PV thrift?
This is the core industrial question. AI and electrification broaden demand, but they do not guarantee that total silver used per unit of output keeps rising.
3. Can mine and scrap supply respond more aggressively at higher prices?
The bear case improves if supply becomes much more elastic. The current evidence supports only gradual improvement, but a decade is a long enough horizon for that to change.
4. Does silver keep its monetary beta?
Silver's biggest upside years typically require it to trade as more than an industrial metal. If macro investors stop treating it as a high-beta precious metal, the long-run ceiling falls.
5. Does AI create more demand than macro pressure?
AI can lift silver by raising demand for electrification, servers, and grid hardware, but it can also pressure precious metals if productivity gains improve real growth and reduce safe-haven demand (IEA data-centre demand; IMF growth analysis).
04. Institutional Forecasts and Analyst Views
The farther out the horizon, the more valuable current institutional forecasts become as boundary markers rather than as direct targets
J.P. Morgan still offers the clearest published bank path, with $81 for 2026 and $85.5 for 2027. That is constructive, but it is not equivalent to a guarantee that silver compounds at the same speed all the way to 2035.
LBMA, meanwhile, shows an average 2026 forecast of $79.57 with a spectacularly wide $42 to $165 range. That tells readers something important: serious analysts agree silver belongs in a very volatile distribution, but they disagree sharply on where the equilibrium price really sits.
The Silver Institute's long-run technology work is the bridge between those shorter-term forecasts and a 2035 thesis. It argues that sectors such as solar, EVs, charging infrastructure, and data centers should keep demand firm through 2030, which makes high long-run ranges possible but still not automatic (Silver Institute technology report).
| Source | Published view | Why it matters |
|---|---|---|
| J.P. Morgan Global Research | $81 average in 2026 and $85.5 in 2027 | One of the clearest big-bank silver forecast paths currently available. |
| LBMA 2026 Forecast Survey | $79.57 average for 2026 | Official industry survey average from a broad analyst panel. |
| LBMA analyst range | $42 to $165 for 2026 | The range itself shows how unstable silver becomes when industrial and precious-metal narratives collide. |
| Silver Institute / Metals Focus 2026 outlook | Sixth straight deficit with downside limited by supportive macro and gold strength | Useful because it links price behavior to actual physical-balance expectations. |
| World Bank October 2025 outlook | Silver annual average expected up 34% in 2025 and another 8% in 2026 | Adds a macro-commodity forecasting frame rather than a pure precious-metals one. |
| LBMA-hosted individual analysts | Published averages span roughly mid-$40s to above $100 | Official analyst submissions show just how wide the plausible distribution still is. |
05. Bull, Bear, and Base Case
The 2035 silver debate is mostly a debate about compounding regimes and substitution risk
Bullish scenario
The bull case is $140 to $200 by 2035. It assumes repeated deficit years, resilient investment demand, and broad industrial growth from electrification, power systems, AI infrastructure, and transportation.
Base-case scenario
The base case is $90 to $135. That range assumes silver stays expensive by historical standards, but no longer lives in a constant squeeze environment. Supply improves somewhat, while demand stays large enough to preserve a high floor.
Bearish scenario
The bear case is $50 to $85. This would likely require much more effective thrift and substitution, a more elastic supply response, and weaker investor demand for precious metals over much of the cycle.
Risks to watch
The key long-run risks are PV substitution, weaker global industrial growth, aggressive scrap response, inventory normalization, and a more stable macro regime that pushes investors toward higher-yielding assets.
What could invalidate the forecast
The base case would be too optimistic if industrial silver use becomes easier to replace and if deficit years fade. It would be too conservative if multiple demand channels stay strong simultaneously and silver keeps functioning as a high-beta hedge against monetary stress.
Conclusion
For 2035, the honest answer is a range, not a slogan. Available data suggests silver has earned a higher long-run floor than in the prior decade, but the evidence is mixed on whether that floor should be treated as permanently explosive.
| Scenario | Illustrative range | What has to happen | Probability |
|---|---|---|---|
| Bull | $140-$200 | Deficits recur, broad industrial demand grows, and silver retains strong monetary beta. | 20% |
| Base | $90-$135 | The market stays structurally firm without a nonstop squeeze regime. | 50% |
| Bear | $50-$85 | Substitution, supply response, and weaker investor appetite dominate the cycle. | 30% |
| Path | Estimated probability | Comment |
|---|---|---|
| Probability of rising | 50% | A higher 2035 price remains the most likely outcome if deficits and diversified tech demand persist. |
| Probability of falling | 20% | A lower long-run path would likely need industrial disappointment and weak precious-metals demand together. |
| Probability of moving sideways | 30% | Extended sideways volatility is plausible because silver can stay elevated without making a clean trend higher every year. |
06. Investor Implications
Long-dated silver forecasts should shape sizing, expectations, and rebalance discipline more than entry timing
A 2035 silver forecast is not a trading signal. Its real use is in portfolio design: how much to allocate, when to rebalance, and how much volatility a reader is willing to tolerate in exchange for long-run upside.
| Investor type | Cautious approach | What to watch |
|---|---|---|
| Investor already in profit | Hold a core allocation if the thesis still fits, but trim or rebalance if silver has become an outsized risk position. | The gold-silver ratio, ETF flows, and whether price spikes are being confirmed by physical demand. |
| Investor currently at a loss | Separate a broken thesis from a bad entry. Average in only if the horizon is long and the supply-demand case still holds. | Evidence that deficits persist and that corrections are orderly rather than panic-driven. |
| Investor with no position | Avoid chasing vertical rallies. Prefer staged entries, pullback plans, or dollar-cost averaging. | Macro risk sentiment, rate expectations, and whether physical-market tightness is easing. |
| Trader | Use stop-losses, respect gap risk, and trade silver as a volatility asset rather than as a tidy trend story. | Dollar moves, gold leadership, inventory headlines, and tariff or policy shocks. |
| Long-term investor | Think in terms of portfolio role, scenario ranges, and rebalancing bands instead of one target. | Whether silver keeps its dual industrial and monetary appeal through the cycle. |
| Reader seeking a hedge | Use silver as a partial hedge, not as a perfect crisis instrument. Combine it with cash, gold, or other defenses if needed. | Whether silver is behaving more like an industrial metal or a safe-haven asset in the current regime. |
Disclaimer: This 2035 scenario work is for research purposes only. It is not a guaranteed terminal value and should not be treated as a personalized recommendation.
07. FAQ
Frequently asked questions about a 2035 silver forecast
Why is the 2035 base case only moderately above current levels?
Because silver is already pricing in a lot of tightness. A high starting point reduces the need for sensational long-run assumptions.
What would make a $200 silver target credible?
Persistent deficits, broad industrial growth, and strong investor demand would all need to remain aligned for years, which is possible but not a default outcome.
What is the biggest long-run risk to the silver thesis?
The biggest structural risk is that photovoltaic and electronics applications continue to reduce silver intensity faster than new end uses can offset it.
References
Sources
- Yahoo Finance SI=F recent daily chart
- Yahoo Finance SI=F 10-year monthly chart
- Silver Institute 2026 market outlook
- Silver Institute World Silver Survey 2026 release
- Silver Institute 2025 deficit outlook
- Silver Institute supply and demand overview
- Silver Institute technology demand release
- Silver Institute silver and solar page
- Silver Institute silver in industry page
- Silver Institute 2025 investment update
- Silver Institute physical silver investment overview
- LBMA 2026 forecast survey
- LBMA 2026 analysts forecasts
- LBMA Alchemist survey summary
- J.P. Morgan Global Research silver outlook
- World Bank commodity outlook October 2025
- World Bank commodity outlook April 2026
- World Bank commodity markets portal
- IEA Electricity 2026 demand analysis
- IEA data-centre electricity news
- IMF AI preparedness speech
- IMF AI Can Lift Global Growth
- IMF AI and Productivity in Europe
- USGS Mineral Commodity Summaries 2026