01. Quick Answer
The most defensible 2030 silver outlook is constructive but still highly conditional on both industrial demand and macro liquidity
COMEX silver futures (SI=F on Yahoo Finance) were trading around $75.7/oz on 2026-05-18. The same 10-year monthly series started near $18.6/oz on 2016-06-01 and most recently showed $75.7/oz, with a 10-year range of roughly $14.1 to $78.3 and a price-only CAGR near 17.78% (10-year monthly data).
A serious 2030 silver forecast should start with the fact that the market already sits in a historically elevated regime. J.P. Morgan sees silver averaging $81 in 2026 and $85.5 in 2027, while the official LBMA survey summary put the 2026 analyst average at $79.57. Those anchors suggest the market already prices in a lot of structural strength, but not necessarily a permanent squeeze.
The base case for 2030 is therefore not that silver simply repeats its 2025-style surge. The base case is that supply stays only modestly responsive, deficits keep chewing through above-ground inventories, and industrial demand remains large enough to support a structurally higher floor even if the path stays volatile (Silver Institute 2026 outlook; World Silver Survey 2026 release).
| Point | Why it matters |
|---|---|
| Historical data | Silver's 10-year monthly price range spans from roughly the low teens to above $120, which is why a range-based forecast is more honest than a single number. |
| Current market conditions | The market is still balancing a sixth consecutive deficit narrative against the reality of slower photovoltaic demand growth and extreme volatility. |
| Institutional forecasts | J.P. Morgan and LBMA both support a high-price regime, but neither implies that every year will look like a squeeze year. |
| Base-case logic | An $80-$115 range by 2030 assumes silver keeps a higher floor without requiring a permanent shortage panic. |
02. Historical Context
The 2030 debate starts with whether silver's latest rerating reflects a lasting structural floor or a temporary liquidity event
The official silver market data is mixed in the most constructive possible way. The Silver Institute's April 2026 release says total 2025 silver demand slipped 2% to 1.13 billion ounces, yet the market still remained in deficit for a fifth straight year. Mine production rose 3% to 846.6 million ounces, but that extra supply did not erase tightness because inventories, ETP holdings, and retail investment behavior all mattered at once (Silver Institute April 2026 release).
The 2026 outlook adds nuance rather than overturning the thesis. Metals Focus, via the Silver Institute, still expects a sixth straight annual deficit, but only around 67 million ounces, with total global supply rising 1.5% to a decade high of 1.05 billion ounces. That means the market can stay tight even while supply improves at the margin (Silver Institute February 2026 outlook).
For a 2030 forecast, that distinction matters. A deficit market does not automatically mean a one-way market. It means silver can stay vulnerable to squeeze episodes and sharp pullbacks at the same time, especially because its industrial share makes demand more cyclical than gold's.
| Metric | Latest reading | Why it matters |
|---|---|---|
| Current silver price | $75.7/oz | Every forward-looking range should be anchored to the current futures market, not to an outdated low. |
| 52-week range | $32.1 to $121.3 | Silver has already shown how wide its volatility band can be in a single year. |
| 10-year monthly range | $14.1 to $78.3 | Helps distinguish a normal correction from a structural break in the thesis. |
| 10-year price CAGR | 17.78% | A very high recent CAGR is a warning against straight-line extrapolation. |
| 2026 J.P. Morgan anchor | $81 average | A major-bank reference point for whether today's level already discounts a lot of the bullish story. |
| Editorial base range | $80-$115 | Scenario ranges are more defensible than pretending silver has one inevitable destination. |
| Line item | Latest official reading | Interpretation |
|---|---|---|
| 2025 total demand | 1.13 billion oz | Demand eased 2% year over year, but stayed historically high even after a huge price move. |
| 2025 mine production | 846.6 Moz | Mine output rose 3%, yet still did not erase the structural tightness narrative. |
| 2025 industrial demand | 657.4 Moz | Industrial offtake slipped 3%, largely because photovoltaic demand cooled from a very high base. |
| 2025 coin and bar demand | +14% y/y | Retail investment partially offset weakness in jewelry, silverware, and industrial uses. |
| 2026 total supply forecast | 1.05 billion oz | Metals Focus still expects a decade-high supply year, which matters for the bear case. |
| 2026 mine supply forecast | 820 Moz | Mine growth is positive but still only around 1%, which limits how fast supply can relieve tightness. |
| 2026 industrial demand forecast | Around 640-650 Moz | AI, autos, and grid demand help, but PV thrifting remains a real headwind. |
| 2026 market deficit forecast | 67 Moz | A sixth consecutive deficit would keep pressure on above-ground inventories. |
03. Main Drivers
Five forces will decide whether silver merely stays expensive or enters another major structural leg higher by 2030
1. Physical deficits still matter, even if they are narrowing
Silver Institute guidance still points to a sixth consecutive deficit in 2026. Even a smaller deficit matters because it implies the market remains dependent on above-ground inventory releases rather than on current mine supply alone.
2. Solar demand is still huge, but thrifting and substitution are real
Silver's strongest secular industrial argument comes from power transition uses. Yet the same Silver Institute sources that highlight solar and electrification also warn that ongoing thrifting and outright substitution are reducing how much silver is used per unit of new solar capacity (2026 outlook; Silver and solar data).
3. AI, data centers, and electrification broaden demand beyond one end market
The more encouraging part of the industrial story is diversification. The Silver Institute says AI infrastructure, EVs, grid investment, and cloud hardware should help drive technology demand through 2030, so silver does not depend on photovoltaics alone (technology demand release; IEA electricity demand outlook).
4. Macro stress still drives the investment side
Silver is not just an industrial material. The Silver Institute's July 2025 investment update reported 95 million ounces of net ETP inflows in the first half of 2025 and total holdings of 1.13 billion ounces by June 30. That reminds investors that macro anxiety can still transform silver from an industrial metal into a financial asset very quickly (Silver Institute investment update).
5. Higher prices can solve part of the problem by destroying demand
The biggest difference between silver and gold is that silver's own success can undermine parts of the demand case. The 2025 survey release linked higher prices to weaker jewelry, silverware, and some industrial demand. So an ultra-bullish path requires tightness without too much self-inflicted demand destruction.
04. Institutional Forecasts and Analyst Views
Institutional evidence supports a structurally firmer silver market, but the published range remains exceptionally wide
J.P. Morgan Global Research sees silver averaging $81 in 2026 and $85.5 in 2027 after a huge 2025 repricing. That matters because it tells investors a major bank still sees silver holding most of its rerating rather than collapsing back toward its pre-surge norms.
The official LBMA survey summary is even more revealing in one sense: not just the $79.57 average forecast for 2026, but the $42 to $165 analyst range. That spread implies the market is still wrestling with two incompatible stories at once, namely a structurally tight industrial metal and a volatility-prone precious metal.
The Silver Institute sits between those views. Its 2026 outlook argues that downside risks should be limited by a supportive macro backdrop and strength in gold, but it also expects weaker photovoltaic intensity and only a modest physical deficit of 67 million ounces. That is exactly the kind of mixed evidence that justifies scenario analysis instead of single-target storytelling.
| Source | Published view | Why it matters |
|---|---|---|
| J.P. Morgan Global Research | $81 average in 2026 and $85.5 in 2027 | One of the clearest big-bank silver forecast paths currently available. |
| LBMA 2026 Forecast Survey | $79.57 average for 2026 | Official industry survey average from a broad analyst panel. |
| LBMA analyst range | $42 to $165 for 2026 | The range itself shows how unstable silver becomes when industrial and precious-metal narratives collide. |
| Silver Institute / Metals Focus 2026 outlook | Sixth straight deficit with downside limited by supportive macro and gold strength | Useful because it links price behavior to actual physical-balance expectations. |
| World Bank October 2025 outlook | Silver annual average expected up 34% in 2025 and another 8% in 2026 | Adds a macro-commodity forecasting frame rather than a pure precious-metals one. |
| LBMA-hosted individual analysts | Published averages span roughly mid-$40s to above $100 | Official analyst submissions show just how wide the plausible distribution still is. |
05. Bull, Bear, and Base Case
A credible 2030 silver forecast needs explicit conditions, probability assumptions, and a clear invalidation framework
Bullish scenario
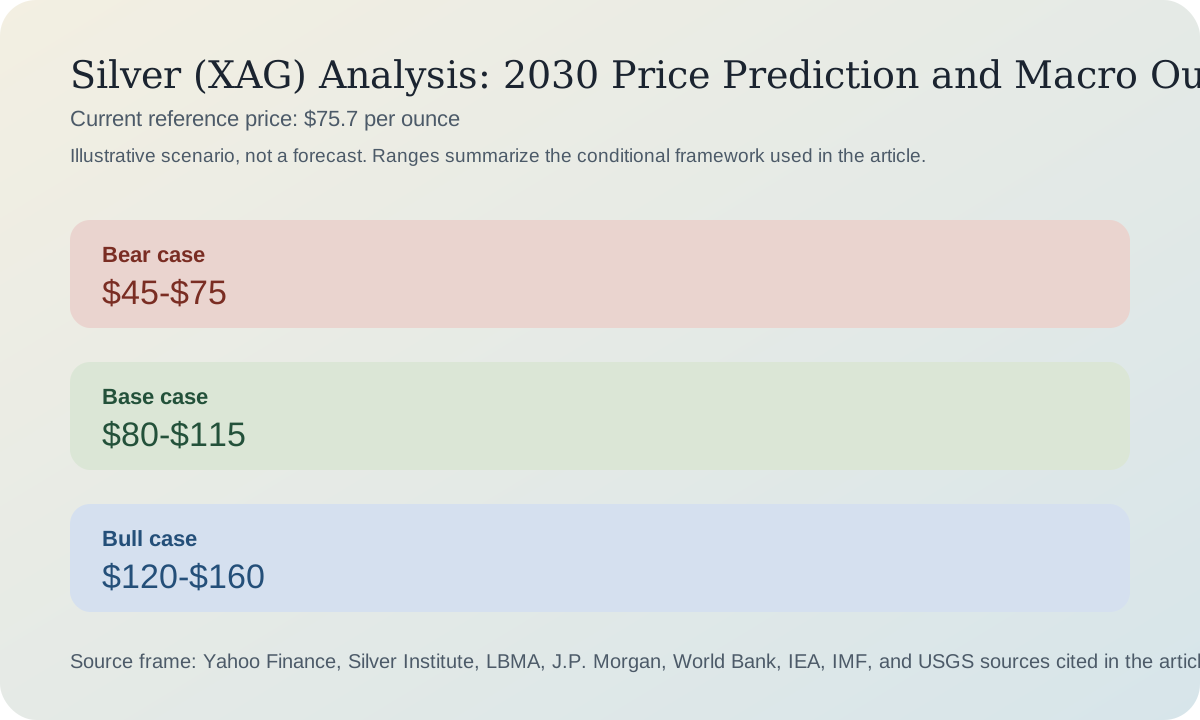
The bull case is $120 to $160 by 2030. It requires physical inventories to remain tight, technology and electrification demand to offset PV thrift, ETP flows to stay positive, and gold to remain supportive enough that macro investors keep using silver as a high-beta monetary asset.
Base-case scenario
The base case is $80 to $115. This range assumes the deficit story survives, but in a more normalized way. Supply grows slowly, industrial demand remains large but not explosive, and price spikes get followed by corrections rather than by immediate collapse.
Bearish scenario
The bear case is $45 to $75. That outcome would likely require a stronger dollar, softer industrial activity, continued silver thrift in solar, and a market view that 2025-2026 represented an overshoot rather than a new equilibrium.
Risks to watch
The main risks are a sharper-than-expected collapse in PV intensity, weaker global manufacturing, a reversal in ETP demand, and mine or scrap supply growing faster than the market now assumes.
What could invalidate the forecast
The constructive base case would be too optimistic if the deficit disappears, PV thrift accelerates faster than AI and electrification demand can offset it, and silver starts trading mainly as a cyclical industrial metal. It would be too conservative if persistent deficits coincide with renewed investment demand and another physical-market squeeze.
Conclusion
Available data suggests silver deserves a higher structural range than it did a decade ago, but the evidence is mixed on whether that range should be treated as stable. By 2030, the most defensible view is still constructive, but only within a wide volatility band.
| Scenario | Illustrative range | Conditions | Probability |
|---|---|---|---|
| Bull | $120-$160 | Persistent deficits, tight inventories, strong investment demand, and resilient tech uses. | 25% |
| Base | $80-$115 | Moderate deficits persist while industrial and monetary demand remain balanced. | 50% |
| Bear | $45-$75 | Industrial softness, stronger supply response, and weaker investor conviction cap the market. | 25% |
| Path | Estimated probability | Comment |
|---|---|---|
| Probability of rising | 55% | A higher long-run range remains the single most likely path if deficits continue. |
| Probability of falling | 20% | A lower 2030 path likely needs both industrial disappointment and macro normalization. |
| Probability of moving sideways | 25% | Sideways-but-volatile is plausible because silver can stay expensive without compounding every year. |
06. Investor Implications
A 2030 framework is only useful if it changes how different silver investors manage risk
Silver attracts very different owners: macro traders, precious-metals allocators, inflation hedgers, and readers drawn to the electrification story. A useful forecast therefore has to translate into positioning discipline, not just into a terminal number.
The same data can justify very different actions depending on whether a reader already has gains to protect, losses to manage, or no position at all. Silver's volatility is too high for careless sizing, especially because sharp rallies can coexist with credible bear cases.
| Investor type | Cautious approach | What to watch |
|---|---|---|
| Investor already in profit | Hold a core allocation if the thesis still fits, but trim or rebalance if silver has become an outsized risk position. | The gold-silver ratio, ETF flows, and whether price spikes are being confirmed by physical demand. |
| Investor currently at a loss | Separate a broken thesis from a bad entry. Average in only if the horizon is long and the supply-demand case still holds. | Evidence that deficits persist and that corrections are orderly rather than panic-driven. |
| Investor with no position | Avoid chasing vertical rallies. Prefer staged entries, pullback plans, or dollar-cost averaging. | Macro risk sentiment, rate expectations, and whether physical-market tightness is easing. |
| Trader | Use stop-losses, respect gap risk, and trade silver as a volatility asset rather than as a tidy trend story. | Dollar moves, gold leadership, inventory headlines, and tariff or policy shocks. |
| Long-term investor | Think in terms of portfolio role, scenario ranges, and rebalancing bands instead of one target. | Whether silver keeps its dual industrial and monetary appeal through the cycle. |
| Reader seeking a hedge | Use silver as a partial hedge, not as a perfect crisis instrument. Combine it with cash, gold, or other defenses if needed. | Whether silver is behaving more like an industrial metal or a safe-haven asset in the current regime. |
Disclaimer: This analysis is for research and informational purposes only. It is not personalized financial advice, and no scenario range should be read as a guaranteed outcome.
07. FAQ
Frequently asked questions about the silver 2030 outlook
Is silver likely to outperform gold by 2030?
It could in a strong risk-on and deficit-driven environment, but silver's industrial exposure also makes it more vulnerable to cyclical slowdowns. That is why the probability band is wider than for gold.
Why use ranges instead of one 2030 target?
Because silver sits at the intersection of industrial demand, macro policy, and investor sentiment. A scenario range is more defensible than pretending the destination is precise.
What matters most between now and 2030?
Inventory tightness, the pace of solar thrift, AI and electrification demand, ETP flows, and whether macro investors keep treating silver as a high-beta precious metal.
References
Sources
- Yahoo Finance SI=F recent daily chart
- Yahoo Finance SI=F 10-year monthly chart
- Silver Institute 2026 market outlook
- Silver Institute World Silver Survey 2026 release
- Silver Institute 2025 deficit outlook
- Silver Institute supply and demand overview
- Silver Institute technology demand release
- Silver Institute silver and solar page
- Silver Institute silver in industry page
- Silver Institute 2025 investment update
- Silver Institute physical silver investment overview
- LBMA 2026 forecast survey
- LBMA 2026 analysts forecasts
- LBMA Alchemist survey summary
- J.P. Morgan Global Research silver outlook
- World Bank commodity outlook October 2025
- World Bank commodity outlook April 2026
- World Bank commodity markets portal
- IEA Electricity 2026 demand analysis
- IEA data-centre electricity news
- IMF AI preparedness speech
- IMF AI Can Lift Global Growth
- IMF AI and Productivity in Europe
- USGS Mineral Commodity Summaries 2026