01. Quick Answer
BTC does not need a broken long-term thesis to suffer another sharp crash
A crash thesis is not the same as a “Bitcoin is worthless” thesis. BTC can remain a relevant macro asset and still fall hard if leverage rebuilds too quickly, ETF flows turn negative, macro liquidity tightens, or a large treasury-style buyer becomes a source of reflexive stress. Traders should distinguish three different events: a correction is often a 10% to 20% pullback, a bear market is a deeper and more persistent decline, and a crash is a rapid drawdown of 30% or more that forces liquidations and changes behavior quickly.
| Category | Evidence-based read | Implication |
|---|---|---|
| Historical data | BTC has a long history of violent drawdowns even inside long-run bull markets | Crash risk is a feature of the asset, not an anomaly |
| Current market conditions | Fidelity and Galaxy both describe a market still dealing with the after-effects of deleveraging | Fragility can remain even after price stabilizes |
| Market structure | CME, ETF wrappers, and treasury vehicles deepen access but also create new contagion channels | Bitcoin is more institutional, not automatically safer |
| Practical read | The next crash would likely come from forced selling and liquidity stress, not from one bad tweet | Risk management matters more than narrative purity |
02. Historical Context
Crash risk should be judged against Bitcoin’s actual drawdown history, not against hopes
Bitcoin does not move like a defensive asset in stress events. Fidelity’s look-ahead report said the October 10, 2025 shakeout triggered forced liquidations and margin calls across derivatives markets, while Galaxy’s February 2026 note said BTC’s drawdown had neared 40%. That is precisely why traders need better language. A 12% dip is not a crash. A 35% air pocket driven by liquidations and flow reversal usually is.
| Metric | Latest reading | Why it matters |
|---|---|---|
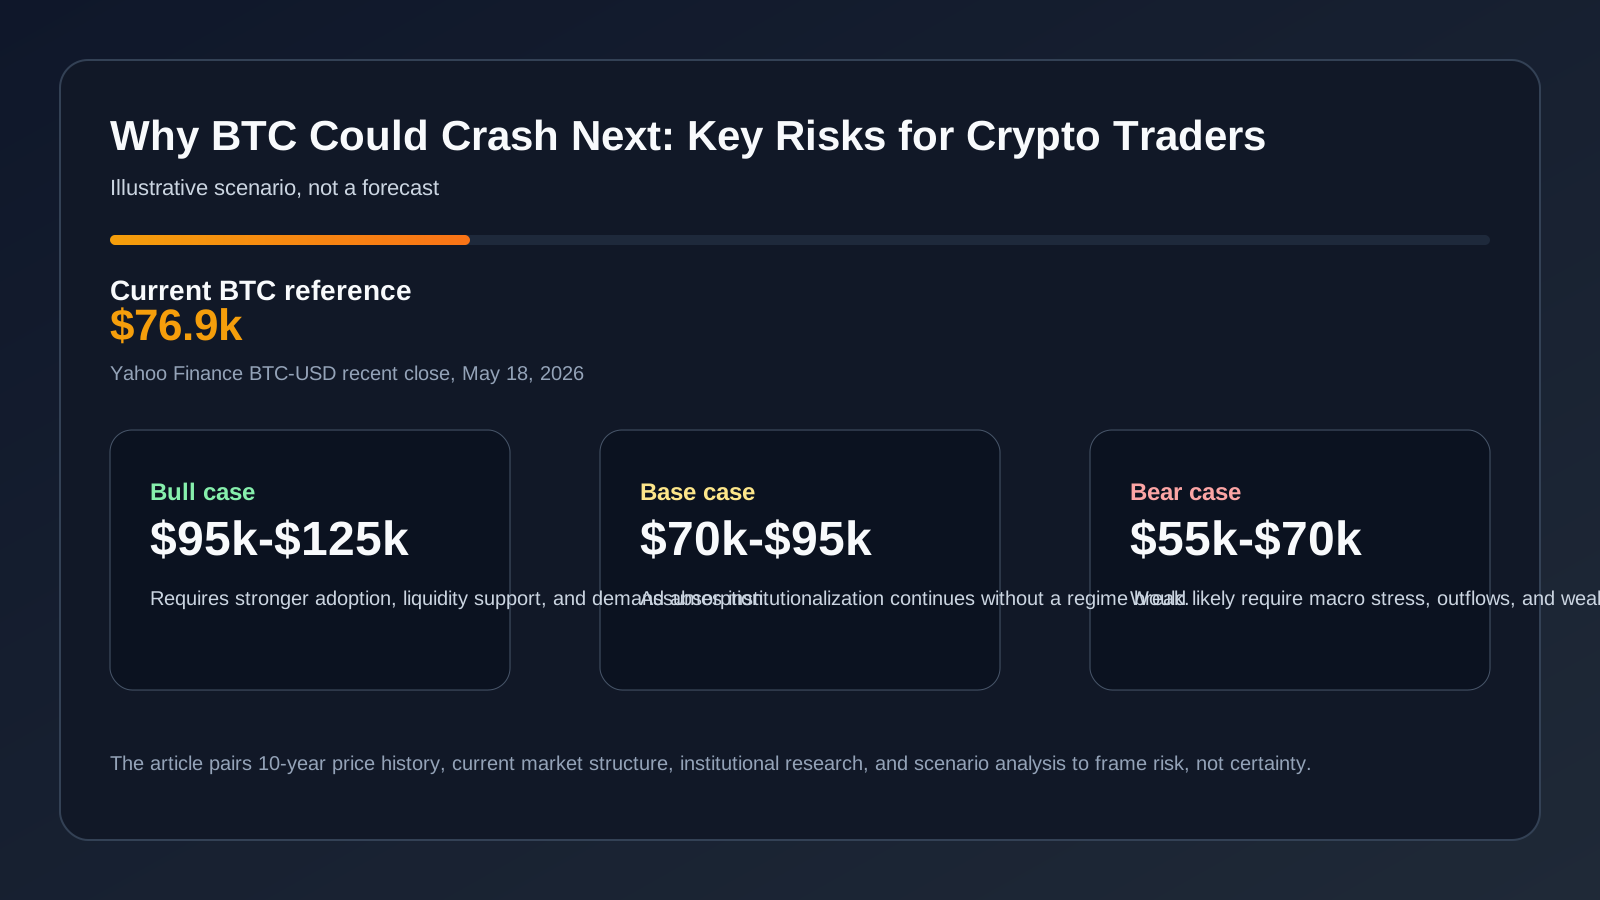
| Recent BTC close | ~$76,864 | Current reference point for evaluating downside stress |
| Psychological overhang | Fidelity says the October 10, 2025 liquidation event still lingers | Sentiment can stay fragile after the initial washout |
| Volatility tooling | CME launched new implied-volatility benchmarks and volatility futures | Institutions now have cleaner ways to express or hedge downside |
| Large treasury concentration | Strategy remains the dominant public-company BTC holder | Concentration can magnify market narratives in stress periods |
| Event type | Typical magnitude | Market behavior | Why it matters |
|---|---|---|---|
| Correction | ~10%-20% | Fast reset, often trend-consistent | Can be normal noise in BTC |
| Bear market | 20%+ and persistent | Confidence fades, rallies fail, sellers stay active | Damages medium-term momentum |
| Crash | 30%+ quickly | Liquidations, forced selling, stress in derivatives and ETFs | Can reset positioning and market psychology violently |
| Reference point | Approximate level | Comment |
|---|---|---|
| 2025 cycle high | Above $126k per Fidelity/Glassnode reference | Shows where sentiment last peaked |
| Early-2026 stress low | Mid-$70k area per Galaxy/Fidelity discussion | Illustrates how quickly BTC can reprice when leverage unwinds |
| Current area | Mid-$70k to low-$80k recent range | Stabilization does not eliminate crash risk if macro or flows deteriorate again |
03. Main Drivers
Five risks could trigger the next BTC crash
1. A new leverage build-up followed by a liquidation cascade
Fidelity’s and Galaxy’s descriptions of the 2025–2026 reset make the core point clear: crashes tend to become violent when they move from discretionary selling to forced selling. If leverage rebuilds while spot demand stays thin, the market becomes vulnerable again.
2. ETF outflows or stalled inflows
ETFs are supportive when they absorb supply. They become a problem when the market assumes they are permanent one-way buyers. If inflows flatten while older holders distribute into every rally, BTC can lose its demand floor fast.
3. Macro risk-off pressure
Fidelity explicitly warned that in a general risk-off move, correlations tend to converge. Translation: even a strong Bitcoin thesis can lose altitude when liquidity dries up and dollar strength rises.
4. Treasury concentration and balance-sheet reflexivity
Strategy is still a net bullish force, but the model creates reflexivity. If financing conditions worsen or if the market starts doubting the durability of treasury-style accumulation, concentrated ownership can flip from support to pressure.
5. Miner and infrastructure stress
Cambridge’s methodology and Fidelity’s AI/mining discussion both show Bitcoin is an industrial network. If energy economics deteriorate, miners can become more aggressive sellers. If they pivot to AI hosting because those returns dominate, the network adjusts, but the transition can still amplify uncertainty.
04. Institutional Forecasts and Analyst Views
Bearish setups are easier to understand when you look at structure rather than ideology
No major institutional source in this research set argues that BTC is headed to zero. The more credible bearish views are structural: Galaxy warned that broader crypto was already in a bear market, said near-term risk remained to the downside until BTC re-established itself above $100,000 to $105,000, and highlighted very wide options-implied distributions. Fidelity argued that while Bitcoin had become more resilient, macro headwinds, stress selling, and dollar strength still threatened lower digital-asset prices. CME’s volatility products underscore the same point from a different angle: downside risk is now a tradable market in its own right.
| Risk factor | Current read | Why traders should care |
|---|---|---|
| Leverage | Reset, but prone to rebuilding | Leverage is the main fuel for air pockets |
| Macro liquidity | Still uncertain | Tighter liquidity can overwhelm crypto-native bullish narratives |
| ETF demand | Structurally supportive, but not guaranteed | Flow reversals can change tape behavior quickly |
| Volatility regime | More mature, not harmless | Lower baseline volatility can still explode during stress events |
05. Bull, Bear, and Base Case
A crash scenario does not cancel the bullish case; it defines the downside path traders must survive
| Scenario | Price zone | Conditions | Probability |
|---|---|---|---|
| Crash | $55k-$70k | Macro stress, negative flows, leverage rebuild, and forced liquidations collide | 25% |
| Base | $70k-$95k | BTC remains fragile but range-bound while the market continues repairing | 45% |
| Relief recovery | $95k-$125k | Macro eases, spot demand improves, and the market reclaims lost momentum zones | 30% |
| Direction | Probability | Comment |
|---|---|---|
| Higher | 30% | Possible, but needs better spot demand and a calmer macro backdrop |
| Lower | 35% | Crash risk remains meaningful because the market still looks headline-sensitive |
| Sideways | 35% | Repair and compression are plausible after a large washout |
| Investor type | Prudent approach | Main watchpoints |
|---|---|---|
| Investor already in profit | Trim if BTC has become too large, and do not confuse a gain with immunity from drawdown | Portfolio concentration and stop discipline |
| Investor currently at a loss | Avoid capitulating into every dip, but also avoid averaging without a defined thesis and time horizon | Cash needs and emotional risk |
| Investor with no position | Wait for volatility to settle or use very small staged entries | Flow stabilization and price structure |
| Trader | Use stop-loss orders, smaller size, and volatility-aware position management | CME volatility, funding, and event risk |
| Long-term investor | Hold only the size you can survive through another 30%+ drawdown without forced selling | Balance-sheet liquidity and conviction quality |
| Risk-hedging investor | Pair BTC with cash, duration, or other hedges instead of assuming BTC hedges itself | Correlation during crisis periods |
What could invalidate the crash thesis? Sustained net inflows, better macro conditions, and convincing price acceptance above the major recovery zone would all weaken it. Traders should stay intellectually flexible: the better risk framework is not permanent bearishness, but respecting how quickly BTC can punish complacency.
06. FAQ
Frequently asked questions
What is the difference between a correction and a crash in Bitcoin?
A correction is usually a routine pullback of roughly 10% to 20%. A crash is faster, deeper, and more liquidation-driven, often exceeding 30% in a short period.
Why can BTC crash even if the long-term thesis stays alive?
Because price is driven by marginal flows, leverage, and liquidity. Long-term adoption does not stop short-term forced selling.
What is the biggest crash trigger right now?
The combination of macro stress and a leverage rebuild is the most dangerous setup, because it can flip normal selling into forced selling.
Should long-term investors ignore crash risk?
No. They may not need to trade every move, but position sizing and liquidity management still matter.
Methodology and Invalidation
How to interpret this BTC crash-risk framework and what would change it
The forecast ranges in this article are scenario bands, not promises. They combine live price data from Yahoo Finance, 10-year context, post-ETF market structure, public-company treasury activity, adoption research, regulated derivatives activity, and institutional commentary from firms such as ARK, Fidelity, Bitwise, Galaxy, and CME. That mix is helpful because bitcoin does not respond to a single variable. It reacts to liquidity, regulation, leverage, adoption, macro sentiment, and the behavior of long-term holders at the same time.
Probability tables in this article are editorial estimates rather than mathematical certainties. They are derived by asking which path currently has the strongest evidence: renewed accumulation and broader institutionalization, prolonged consolidation after the 2025–2026 reset, or a deeper repricing caused by macro stress and forced selling. Where the evidence is mixed, the range stays wide on purpose. False precision is usually a sign that the analyst is hiding uncertainty rather than measuring it honestly.
The most important discipline is to state what would invalidate the working view. The bearish setup would be weakened by cleaner spot accumulation, continued institutional inflows, and evidence that the market can absorb stress without another derivatives-led liquidation cascade. Investors who are already in profit, investors sitting on losses, traders, hedgers, and long-term allocators do not need the same playbook, so the positioning table separates horizon and risk tolerance instead of pretending one answer fits everyone. Disclaimer: This article is for informational and research purposes only and does not constitute personalized financial advice.
References
Sources
- Yahoo Finance BTC-USD chart API, 10-year monthly price history
- Yahoo Finance BTC-USD chart API, recent daily closes
- U.S. SEC, statement on the approval of spot Bitcoin exchange-traded products, January 10, 2024
- ARK Invest, Bitcoin 2030 price-target methodology, April 24, 2025
- Fidelity Digital Assets, Is Bitcoin’s Four-Year Cycle Over?, February 24, 2026
- Fidelity Digital Assets, 2026 Look Ahead report
- Strategy, first-quarter 2026 results and bitcoin treasury update, May 5, 2026
- Chainalysis, 2025 Global Crypto Adoption Index
- CME Group, Crypto Catch-Up Q4 2025
- The White House, Strategic Bitcoin Reserve executive order, March 6, 2025
- Cambridge Centre for Alternative Finance, Bitcoin electricity consumption methodology
- Bitwise, 10 Crypto Predictions for 2026
- Galaxy Research, 26 crypto, bitcoin, DeFi, stablecoin, and AI predictions for 2026
- Bitcoin.org, Bitcoin Core validation and the 21 million supply rule
- Galaxy Research, Bitcoin drawdown nears 40%; weakness suggests lower prices coming, February 3, 2026
- CME Group, Bitcoin volatility futures launch announcement, May 5, 2026
- IMF, Global Financial Stability Report, October 2025