01. Quick Answer
Yes, the Nifty 50 could slide, but the size of the move depends on regime
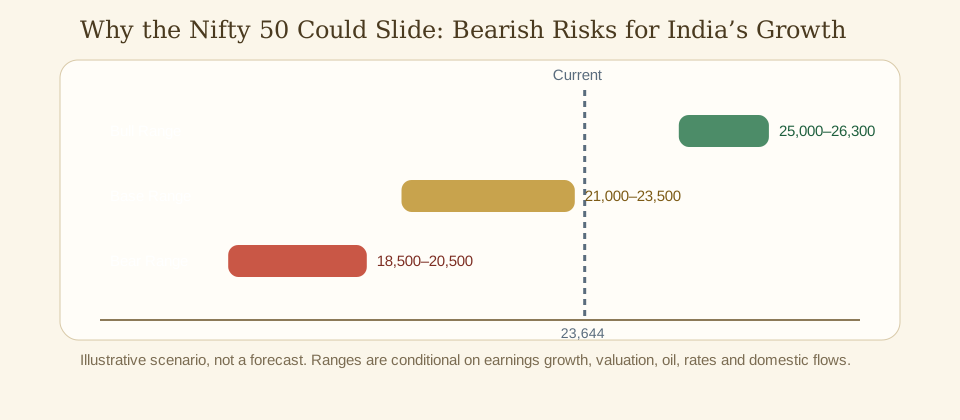
Available data suggests the Nifty 50 remains vulnerable to downside episodes if oil stays high, earnings revisions keep slipping, or domestic liquidity loses momentum. A normal correction would likely sit in the 21,000 to 23,500 area. A deeper bear-market move toward 18,500 to 20,500 would probably require both multiple compression and broad earnings disappointment. A true crash would need stronger evidence of forced liquidation or systemic financial stress, which current official data do not show.
- Correction, bear market, and crash are different regimes and should not be conflated.
- The largest immediate risks are oil, earnings downgrades, and valuation premium.
- India's macro backdrop is resilient, but resilience does not eliminate equity downside.
- A bearish case can be valid tactically even if the long-term structural story remains intact.
02. Current Market Snapshot
Recent volatility already proved that sentiment can flip fast
As of May 15, 2026, the Nifty 50 closed near 23,643.50, according to Yahoo Finance chart data[1]. That puts the benchmark well above its 10-year monthly low of 8,185.80 but still below the 1-year high of 26,328.55 reached on January 02, 2026[1]. In other words, this is not a washed-out index, but it is no longer trading at the peak optimism seen in early 2026.
The official April 30, 2026 Nifty factsheet adds useful context: the index still showed a negative 1-year price return of 1.38%, a 5-year price CAGR of 10.40%, a P/E of 20.94, a P/B of 3.29, and a dividend yield of 1.3%[2]. Those figures matter because most long-range Nifty forecasts ultimately come down to three variables: earnings growth, starting valuation, and how much domestic liquidity continues to cushion external shocks.
| Metric | Value | Why it matters |
|---|---|---|
| Recent close | 23,643.50 on May 15, 2026 | Starting point for all scenario work |
| 10-year range | 8,185.80 to 26,202.95 | Shows how much repricing India large caps have already delivered |
| 10-year CAGR | 11.11% | Useful reality check against aggressive long-term projections |
| 1-year high / low | 26,328.55 / 22,331.40 | Captures the early-2026 correction and rebound window |
| Deepest 10-year drawdown | -38.44% | Distinguishes normal volatility from a true crisis phase |
| Official valuation snapshot | P/E 20.94, P/B 3.29, yield 1.3% | Valuation discipline is central to any Nifty forecast |
The starting point for any bearish argument is that the market is not deeply discounted. That means it does not need a recession to fall. It only needs investors to decide that earnings and liquidity do not justify the premium they were previously willing to pay.
03. Historical Context And Main Drivers
The bearish thesis is built on identifiable stress channels
Over the past decade, the Nifty 50 compounded at roughly 11.11% annually from 8,287.75 to 23,643.50[1]. That record supports a constructive long-run view on Indian large caps, but it also reminds investors that heroic forecasts should be tested against what the index has historically delivered. Even strong structural stories rarely move in straight lines.
The most severe drawdown in the 10-year daily series was about -38.44%, from 26,328.55 on January 02, 2026 to 7,610.25 on March 23, 2020[1]. That distinction matters. A correction can be uncomfortable; a bear market involves deeper multiple compression and earnings stress; a crash usually requires forced liquidation or a macro shock. Readers searching for a Nifty forecast should be explicit about which regime they are actually discussing.
| Driver | Current evidence | Bullish implication | Bearish implication |
|---|---|---|---|
| Oil shock | World Bank and broker notes keep flagging energy risk | If oil cools, downside pressure eases | If oil stays high, margins and inflation can both worsen |
| Valuation premium | Nifty factsheet still shows P/E above 20 | A cheap market can absorb bad news better | A premium multiple can unwind quickly |
| Earnings downgrades | J.P.Morgan and others cut expectations | Stabilization would reduce downside | Further cuts can force repricing even without recession |
| Index concentration | Financials dominate the benchmark | Strong banks can steady the index | A banking wobble can transmit broad weakness |
| Foreign risk appetite | India competes with other EMs for capital | Improved global risk mood helps | A global risk-off phase can compress India's premium |
The bearish case is credible precisely because it does not require a dramatic domestic collapse. India can still grow faster than peers while the Nifty declines if the market decides valuations got ahead of profits. That is a common source of confusion in public commentary: macro resilience and equity downside can coexist.
The other reason the bear case deserves attention is that broker downgrades have become more explicit. J.P.Morgan moved India to neutral and published a 20,500 bear case, while HSBC cut India to underweight as oil-driven risks intensified. Those are not fringe calls; they are direct expressions of how fast sentiment can deteriorate when macro stress hits a richly priced market.
04. Institutional Forecasts And Analyst Views
Current institutional caution gives the downside case real credibility
There is a practical limit to what institutional forecasts can tell investors beyond one or two years. Banks publish abundant 12-month targets, but very few publish formal 2030 or 2035 Nifty targets. That means any long-range projection should be treated as a scenario framework built on current earnings expectations, macro assumptions, and plausible valuation bands, not as a precise institutional consensus number[7] [8].
| Source | Target / stance | Core thesis | What it signals |
|---|---|---|---|
| J.P.Morgan | 20,500 bear case | Oil-led earnings pressure plus elevated valuations | Defines a realistic bearish band |
| HSBC | Underweight India | Current macro setup looks less attractive than some regional peers | Signals relative valuation risk |
| Nomura / Citi | Targets cut | Middle East conflict raised macro and earnings concerns | Shows how quickly upside assumptions can be revised down |
| World Bank / IMF | Macro still resilient but risks remain significant | No crisis call, but clear downside channels exist | Bearish equity views do not require bearish macro collapse |
This matters because bearish analysis is often dismissed as emotional or sensational. The latest institutional material does not support that dismissal. It shows a rational, evidence-based concern that India's premium valuation could compress if earnings fail to keep up with expectations or if oil erodes the macro cushion.
At the same time, none of these sources are calling for a systemic financial event. That distinction is important. A correction or bear market is a repricing event; a crash usually requires far more severe credit or liquidity dysfunction.
05. Bullish Scenario
What would stop the slide and make the bearish case wrong
A bearish article still needs a rebuttal. The simplest invalidation path is better earnings data combined with lower energy pressure. If margins stabilize, domestic inflows stay strong, and large financials keep delivering, the market can recover quickly because the structural India narrative remains attractive to both local and global investors.
That is why downside calls should be tactical and conditional, not absolute. The market does not need a perfect macro backdrop to bounce. It only needs risk perception to improve enough that investors decide the valuation premium is worth paying again.
06. Bearish Scenario
What a true bearish path would look like in practice
A normal correction would likely involve the market sliding into the 21,000 to 23,500 area as expectations reset. That move could happen with only moderate earnings pressure. A deeper bear market, by contrast, would likely require the benchmark to lose confidence in financials, absorb further earnings downgrades, and face a worse external energy environment simultaneously.
Only after those conditions are present should investors discuss a move closer to 18,500 to 20,500. And even then, that would still be different from a crash. A crash would require signs of disorderly liquidation, credit stress, or a much sharper macro break than current official sources imply.
07. Base Case
The base case is a correction risk, not a disaster thesis
On balance, the evidence supports a bearish-risk article more than an outright collapse thesis. The market is rich enough to correct, concentrated enough to be vulnerable, and externally exposed enough to care about oil. But India's macro data, RBI guidance, and domestic fund-flow support still argue against assuming a systemic unraveling.
That makes a correction-style base case more credible than a crash narrative. Investors should prepare for lower prices without pretending they know a structural break is inevitable.
08. Probability Framework And Investor Positioning
Downside probabilities and how different investors might respond
These probabilities separate a standard correction from a deeper bear-market path and from a sideways stabilization outcome.
| Path | Probability | Conditions |
|---|---|---|
| Falling into correction zone | 40% | Valuation and oil concerns remain unresolved |
| Falling into bear-market zone | 20% | Needs broader earnings deterioration and sharper multiple compression |
| Moving sideways / stabilizing | 40% | Possible if domestic flows hold and macro stress fades |
| Investor profile | Prudent approach | Why that stance fits |
|---|---|---|
| Investor already in profit | Trim weaker names, raise some cash, hedge selectively | Protecting gains matters when valuation is not cheap |
| Investor currently at a loss | Avoid panic; distinguish cyclical weakness from broken thesis | Selling everything into stress often locks in poor decisions |
| Investor with no position | Wait for pullback confirmation; avoid chasing rebounds | Downside articles are most useful for patience |
| Trader | Use hard stop-losses and define correction vs bear-market setups | Tactical discipline matters more than narrative conviction |
| Long-term investor | Rebalance, add gradually only to high-quality exposure | Volatility can create opportunity, but not every dip is equal |
| Hedger / risk-only investor | Use partial hedges and monitor oil and earnings revisions | These are the clearest live indicators for the downside case |
Investors do not need to be perma-bears to respect downside math. They only need to recognize that valuation-rich markets can fall hard without invalidating the country's long-term growth model.
09. Risks To Watch And What Could Invalidate The Forecast
The most dangerous mistake is to label every decline a crash
Corrections, bear markets, and crashes have different causes and different policy responses. A correction is usually valuation and positioning. A bear market usually includes earnings stress and broader multiple compression. A crash involves much more disorder. Using the wrong label leads to the wrong strategy.
This bearish framework would fail if oil softens, earnings stabilize, and the index regains prior highs with broader participation. It would strengthen if downgrades widen and domestic flow support weakens. In short, the bearish case is observable; it is not a matter of mood.
| Signal | Why it matters | Implication for the thesis |
|---|---|---|
| Index reclaims prior highs above 26,300 with broader breadth | Would show the market is absorbing macro risk | Bear case weakens materially |
| Oil normalizes and inflation stays benign | Would improve policy flexibility and margins | Downside probabilities fall |
| Broker earnings cuts stop worsening | Would reduce valuation stress | Correction thesis becomes less urgent |
Disclaimer: This article is an editorial scenario analysis, not personalized investment advice. Forecast ranges are conditional and can fail if earnings, policy, energy prices, or global liquidity move materially away from current assumptions.
10. Conclusion
The bearish Nifty case is about repricing risk, not doom
The Nifty 50 could absolutely slide from here, and investors should not dismiss that possibility. But the strongest bearish case is a disciplined repricing framework, not a sensational crash narrative. India's structural story still matters; it just does not cancel valuation, oil, and earnings risk. The practical response is caution, not panic.
FAQ
Frequently asked questions
What is the difference between a correction and a bear market in the Nifty?
A correction is usually a 10% to 15% pullback; a bear market typically means a deeper, more persistent decline with broader earnings and valuation stress.
Is a Nifty crash likely right now?
Current official and institutional sources do not strongly support a crash thesis. They support correction and bear-market risk more clearly.
Why can the Nifty fall even if India's economy keeps growing?
Because equity prices reflect expectations and valuation, not just GDP growth.
What should investors watch first in a bearish setup?
Oil prices, earnings revisions, domestic inflows, and the performance of heavyweight financials.
References
Sources
- Yahoo Finance chart data for ^NSEI - 10-year monthly and 1-year daily history
- NSE Indices, Nifty 50 Factsheet, April 30, 2026
- Reserve Bank of India monetary policy press release - GDP growth 6.5% and CPI 3.1% outlook
- IMF Executive Board Concludes 2025 Article IV Consultation with India
- World Bank India Development Update, April 2026
- AMFI Monthly Note, April 2026 - SIP contributions and equity flows
- Reuters via MarketScreener - J.P.Morgan downgrades India to neutral and cuts Nifty target to 27,000
- Reuters via MarketScreener - Citi and Nomura cut India Nifty targets on oil and earnings risks
- Reuters via MarketScreener - HSBC downgrades India to underweight as oil shock clouds earnings recovery