01. Quick Answer
Yes, the Sensex could slide, but the size of the move depends on regime
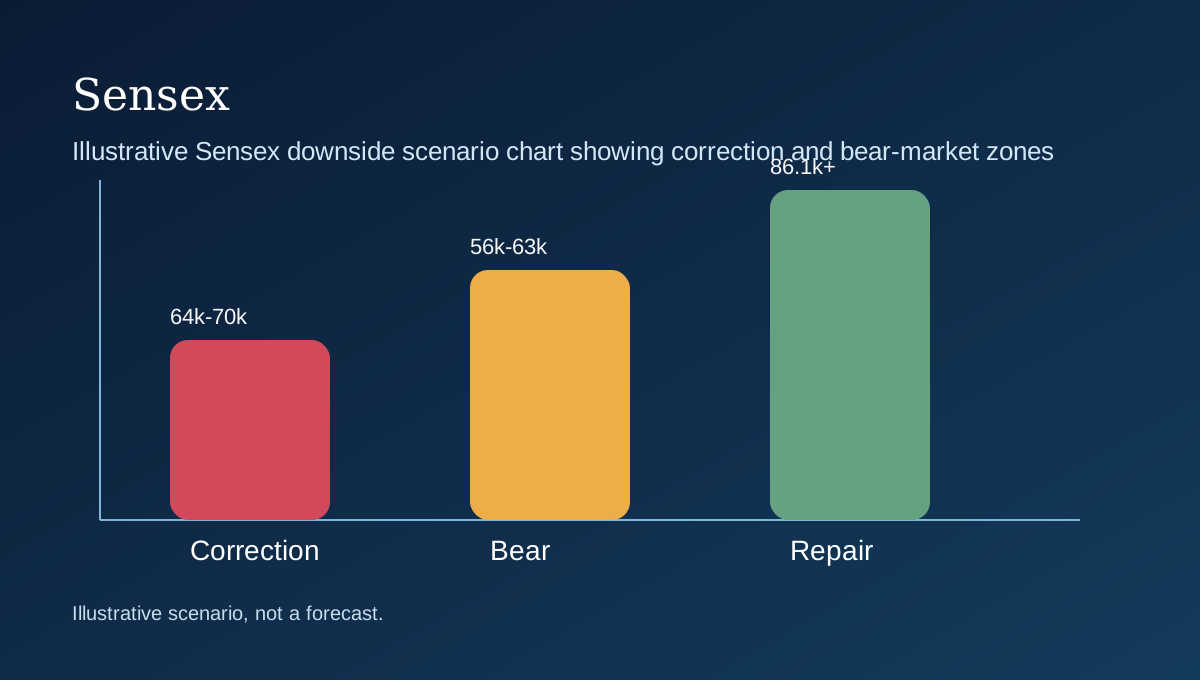
Available data suggests the Sensex remains vulnerable to downside episodes if oil stays high, earnings revisions slip, or domestic liquidity loses momentum. A normal correction would likely sit in the 64,000 to 70,000 area. A deeper bear-market move toward 56,000 to 63,000 would probably require both multiple compression and broader earnings disappointment.
A true crash would need stronger evidence of forced liquidation or systemic financial stress, which current official data do not show. That distinction matters because many bearish headlines mix ordinary corrections, valuation resets, and genuine crises as if they were the same thing.
- Historical data supports a constructive long-run view, but not a straight-line rally.
- Current market conditions show resilience, yet Sensex concentration makes breadth important.
- Institutional forecasts are strongest over 12 to 24 months, so longer targets should stay scenario-based.
- Bull, bear, and base cases depend on earnings growth, domestic flows, oil, and valuation discipline.
02. Current Market Snapshot
A Sensex outlook needs a current anchor before it can become a forecast
As of May 15, 2026, the Sensex closed near 75,237.99, according to Yahoo Finance chart data[1]. That leaves the benchmark below its 52-week high of 86,159.02 but above the 52-week low of 71,545.81[2]. The market is therefore not washed out, but neither is it trading at the euphoric high reached in late 2025.
History also matters here. Over the past decade, monthly closes moved from about 26,999.72 in late May 2016 to 75,237.99 in mid-May 2026, a roughly 10.79% annualized gain[1]. The BSE's 40-year paper adds a longer lens: it notes about 13.4% annualized Sensex growth over 39 years, in line with nominal GDP growth, while also emphasizing that sector leadership has changed materially over time[5].
| Metric | Value | Why it matters |
|---|---|---|
| Recent close | 75,237.99 on May 15, 2026 | Starting point for all scenario work |
| 10-year range | 26,626.46 to 85,706.67 | Shows how much India's large-cap benchmark has already repriced |
| 10-year CAGR | 10.79% | Useful reality check against aggressive long-run projections |
| 1-year high / low | 86,159.02 / 71,545.81 | Captures the 2025 peak and the 2026 stress window |
| Deepest 10-year drawdown | -38.07% | Helps separate a correction from a true bear market |
| Structural concentration | Top 10 names about 65% of index weight | Leadership breadth matters more than headline GDP alone |
The other reason current structure matters is concentration. According to the BSE Sensex at 40 paper, financial-services weight nearly doubled from about 22% in 2005 to roughly 39.5% in 2025, and the top 10 names represent about 65% of the benchmark's weight[5]. That means the headline market story can look healthy even when leadership is narrower than many investors assume.
03. Historical Context And Main Drivers
The bearish thesis is built on identifiable stress channels
Sensex behavior over the last decade already shows why forecast language has to stay disciplined. The daily series implies a maximum drawdown of roughly -38.07%, from 41,952.63 on January 14, 2020 to 25,981.24 on March 23, 2020[2]. That was a genuine crisis drawdown, not a routine correction. Distinguishing correction, bear market, and crash is not semantics; it changes how investors should interpret risk.
| Driver | Current evidence | Bullish implication | Bearish implication |
|---|---|---|---|
| Oil shock | World Bank and broker notes keep flagging energy risk | If oil cools, downside pressure eases | If oil stays high, margins and inflation can both worsen |
| Valuation premium | India still trades at a premium to many EM peers | A cheap market can absorb bad news better | A premium multiple can unwind quickly |
| Earnings downgrades | J.P.Morgan and Citi both referenced earnings risks | Stabilization would reduce downside | Further cuts can force repricing even without recession |
| Index concentration | Financials and top names dominate the benchmark | Strong leaders can steady the index | Leadership fatigue can drag the whole benchmark down |
| Foreign risk appetite | India still competes with other EMs for capital | Improved global risk mood helps | Risk-off phases can compress India's premium |
The bearish case is credible precisely because it does not require a domestic collapse. India can still grow faster than peers while the Sensex falls if the market decides valuations got ahead of profits. That is a common source of confusion in public commentary: macro resilience and equity downside can coexist.
The bear case also deserves attention because recent institutional notes have become more explicit. J.P.Morgan moved India to neutral on oil-led earnings risks and valuation concerns, while Citi and Nomura cut targets as macro stress intensified[11][13]. Those are not fringe calls. They are clear examples of how quickly sentiment can deteriorate when stress hits a richly priced market.
04. Institutional Forecasts And Analyst Views
Current institutional caution gives the downside case real credibility
There is a practical limit to what institutional forecasts can tell investors beyond one or two years. Most sell-side houses publish 12-month targets, not clean 2030 or 2035 endpoints. That means any longer-horizon Sensex estimate should be treated as a scenario framework built from current valuation, earnings assumptions, macro conditions, and credible institutional anchors rather than as a precise consensus number[10][11][12][13].
| Source | Target / stance | Core thesis | What it signals |
|---|---|---|---|
| J.P.Morgan | Neutral on India | Oil-led earnings risks and higher valuations hurt risk-reward | Downside can emerge without a domestic crisis |
| Citi / Nomura | Targets cut on earnings and macro risks | Middle East stress darkened the macro picture | Risk regime can change quickly |
| HSBC | Earlier caution around oil shock before later upgrade | Energy pressure can cloud recovery narratives | Oil remains the main tactical bear argument |
| World Bank | No index target, but explicit warning on energy and external risk | Macro resilience is real but vulnerable | Supports a correction thesis without implying collapse |
For a bearish article, the practical value of institutional material is simple: it proves the downside case is not merely theoretical. J.P.Morgan's neutral call and Citi's cuts both show how quickly large houses can shift when oil and earnings risks intensify.
That does not mean a crash is the base case. It means the market is priced well enough that it does not need a recession to fall. It only needs investors to conclude that earnings and liquidity do not justify the premium they were previously willing to pay.
05. Bullish Scenario
What would stop the downside case from deepening
The easiest way to break the bear thesis is a combination of softer oil, stable inflation, and cleaner earnings delivery. If the macro stress channels fade before profit expectations fall materially, the market can recover without ever entering a full bear-market regime.
A second form of invalidation is stronger domestic support than skeptics expect. If SIP flows remain robust and local institutions keep using volatility to add, a correction can stay shallow even while foreign sentiment remains cautious.
06. Bearish Scenario
What could drag the Sensex toward 56,000 to 63,000
A genuine bear-market path probably requires more than one stress channel at once. The cleanest version is oil pressure, earnings downgrades, and multiple compression happening together. If crude stays elevated, the rupee weakens, inflation becomes less comfortable, and the largest financial or conglomerate names disappoint, the benchmark could reprice materially lower.
The other risk is that investors underestimate how concentrated the benchmark is. When leadership is narrow, the market can look stable until a few heavyweights break. That kind of concentration risk does not always create a crash, but it can make downside moves travel faster than many bottom-up investors expect.
07. Base Case
Why a normal correction remains more likely than a crash
The base bearish case is still a correction, not a systemic event. Official macro data do not currently show a domestic crisis, and household participation still provides some ballast. That argues for respecting the downside without overstating it.
In practical terms, that means the 64,000 to 70,000 zone is easier to defend than a much more dramatic collapse scenario unless fresh evidence appears around banking stress, forced liquidation, or a much sharper macro shock.
08. Probability Framework And Investor Positioning
Probability table and positioning by investor type
The probabilities below are judgment calls, not objective odds. They combine the starting valuation, the Sensex's concentration, official macro material, domestic flow data, and current institutional notes. The point is to show how a forecast range is built rather than to pretend precision where none exists.
| Path | Probability | Conditions |
|---|---|---|
| Rising from current levels | 35% | Possible if oil eases and earnings stabilize faster than bears expect |
| Falling into correction or bear-market zones | 40% | Would likely need continued oil stress, weaker earnings, and premium compression |
| Mostly sideways / volatile range | 25% | Possible if domestic flows offset part of the negative macro impulse |
| Investor profile | Prudent approach | Why that stance fits |
|---|---|---|
| Investor already in profit | Hold core, trim weak positions, rebalance on strength | Protect gains without treating every rally as permanent |
| Investor currently at a loss | Avoid panic selling; review thesis, stagger exits or adds | Entry price risk is different from broken market structure |
| Investor with no position | Wait for pullbacks or use staged dollar-cost averaging | A full-size entry into a premium market raises regret risk |
| Trader | Use stop-loss rules and respect oil, rupee, and earnings catalysts | Short-term price action can diverge sharply from the macro story |
| Long-term investor | Accumulate selectively and rebalance sector concentration | Time horizon helps only if sizing stays disciplined |
| Hedger / risk-only investor | Use partial hedges, avoid overpaying for tail risk | India has macro risk, but not every risk deserves an extreme hedge |
For most readers, the practical implication is the same across themes: avoid treating a structural India story as a license to chase price. The benchmark can remain attractive over the long run while still being vulnerable to valuation resets, oil shocks, and leadership rotations.
09. Risks To Watch And What Could Invalidate The Forecast
Downside analysis should focus on triggers, depth, and invalidation
The key thing to monitor is not whether a bearish headline exists. It is whether the specific triggers behind that headline are strengthening or weakening. Energy, inflation, financial earnings, and domestic liquidity all sit near the center of this debate.
What would invalidate the bearish thesis? A recovery back above the 52-week high area, cleaner earnings breadth, and a calmer energy backdrop would all argue that the market absorbed its risks better than expected. That would not erase volatility, but it would weaken the case for a deeper downtrend.
| Signal | Why it matters | Implication for the thesis |
|---|---|---|
| Sensex reclaims and holds above 86,159 | Would signal stronger momentum and narrative repair | The deeper downside case would weaken materially |
| Oil and inflation pressure retreat | Would reduce macro stress on margins and rates | Correction odds fall and bull probability rises |
| Financial leaders keep delivering strong earnings | The benchmark depends heavily on them | A key transmission channel for the bear case would break |
Disclaimer: This article is editorial scenario analysis, not personalized financial advice. Forecast ranges are conditional and can fail if earnings, policy, liquidity, inflation, or geopolitics move materially away from current assumptions.
10. Conclusion
The bearish Sensex case is real, but it should stay proportionate
A serious bearish view on the Sensex does not need to become melodrama. The benchmark can correct meaningfully if oil, earnings, and valuations all lean the wrong way, and current institutional caution gives that risk credibility. But the evidence still argues for distinguishing a normal correction from a true crash. That distinction is where better risk management begins.
FAQ
Frequently asked questions
Could the Sensex enter a bear market without an Indian recession?
Yes. A premium market can fall into a bear-market regime if valuations compress and earnings disappoint, even while the economy still grows.
What is the difference between a correction and a crash here?
A correction is a smaller valuation reset. A crash usually requires forced liquidation or systemic stress. The current data fit the former risk more easily than the latter.
Why is oil such a big issue for the Sensex?
Because imported energy pressure can affect inflation, margins, the rupee, and central-bank flexibility at the same time.
What would make the downside case wrong?
A strong recovery in breadth, calmer energy prices, and a move back above prior highs would all weaken the bear thesis.
References
Sources
- Yahoo Finance chart data for ^BSESN - 10-year monthly history
- Yahoo Finance chart data for ^BSESN - daily history for drawdowns and 52-week range
- BSE Sensex at 40 research paper, January 2026
- World Bank India Development Update, April 2026
- AMFI Monthly Note, April 2026
- Reuters via TradingView - HSBC upgrades Indian equities to overweight, sees Sensex at 94,000 by 2026-end
- Reuters via MarketScreener - J.P.Morgan downgrades India equities to neutral on oil-led earnings risks
- Reuters via MarketScreener - Citi cuts India's Nifty target on earnings and macro risks from the Iran war
- MoSPI CPI release for March 2026, published April 13, 2026
- PIB WPI release for April 2026, published May 14, 2026