01. Quick Answer
WTI Forecast 2035: Bull, Bear, and Base Case Price Scenarios
The short answer is that 2035 demands a wider range than 2030 because too many structural variables are unresolved. EIA's long-run narrative still describes Brent staying below 70 dollars in real 2025 dollars through 2030 and only rising above 75 dollars in the late 2030s, while OPEC projects demand growth continuing well beyond 2030. Those two ideas can coexist, but they imply very different price paths depending on whether supply keeps pace (EIA, Annual Energy Outlook 2026 narrative; OPEC, World Oil Outlook 2025).
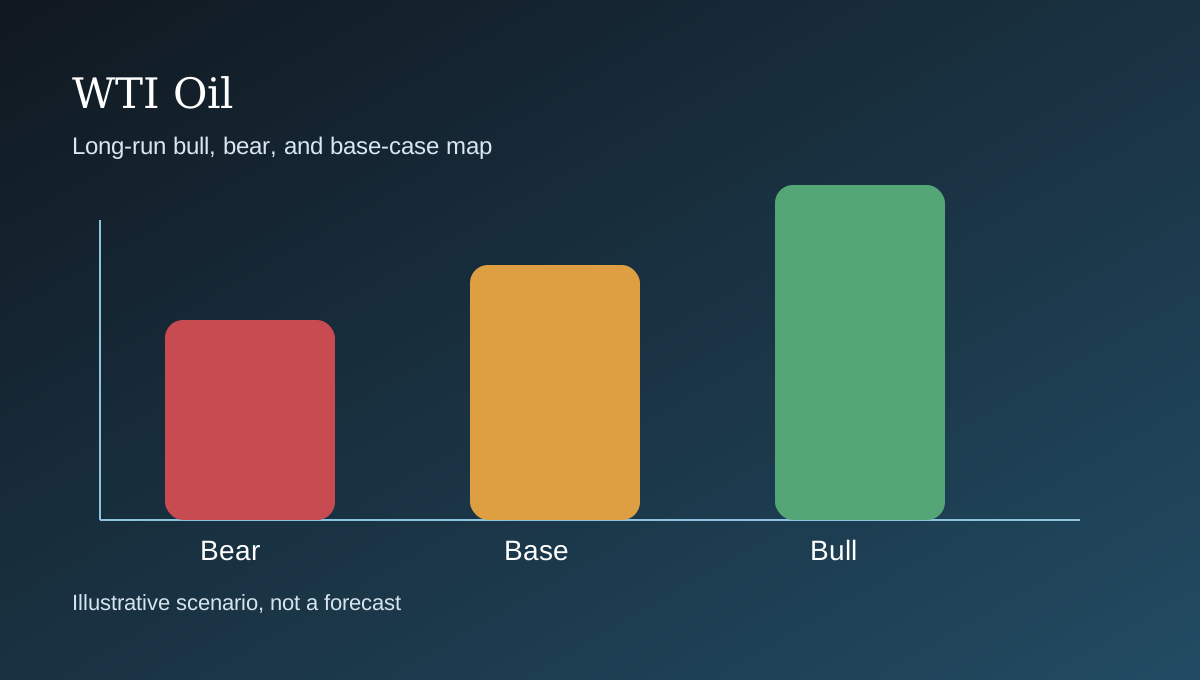
A balanced editorial 2035 range is 65 to 90 dollars per barrel for WTI, with a bull case of 95 to 130 and a bear case of 45 to 65. That framework acknowledges Goldman's reduced long-run WTI estimate around 71 dollars, but it also leaves room for a structurally tighter world if decline rates, upstream underinvestment, and OPEC+ market management matter more than demand destruction (Investing.com summary of Goldman Sachs cutting 2030-2035 Brent and WTI estimates to $75 and $71; Reuters/MarketScreener on Goldman seeing 2026 surplus and long-run Brent/WTI near $80/$76 by late 2028; OPEC, World Oil Outlook 2025, liquids supply chapter).
| Category | Evidence-based read | Implication |
|---|---|---|
| Historical context | WTI already moved from 18.84 to above 100 dollars inside one decade. | 2035 starts from a market that has repeatedly repriced on shocks and scarcity narratives. |
| Structural split | EIA is more cautious on long-run pricing than OPEC on long-run demand. | The core debate is not whether oil matters, but how scarce it stays. |
| Most likely path | A high but non-explosive clearing range is more defensible than permanent triple-digit oil. | The base case matters more than extreme headlines. |
| Main uncertainty | Capital discipline, decline rates, and demand substitution all compound over time. | Long horizons amplify small assumption changes. |
02. Historical Context
Current market snapshot and historical context
WTI's 10-year range of $18.84 to $105.76 per barrel is the first reason any forecast has to be scenario-based rather than point-based. Oil is not a stable compounder. It is a clearing price for a system shaped by geology, OPEC+ policy, inventories, freight constraints, war risk, and global growth. The same benchmark that collapsed in 2020 recovered above $100 in both 2022 and 2026, which means investors should distinguish between a correction, a cyclical bear market, and a structurally lower oil regime (Yahoo Finance chart API, CL=F 10-year monthly data; IEA, Global Energy Review 2026: Oil).
A long-dated WTI framework also has to respect path dependency. If 2026-2028 resolves into surplus, 2035 starts from a weaker capital-spending base. If repeated shocks keep balances tight, the 2030s inherit a thinner project pipeline and a more aggressive OPEC. That is why long-run oil analysis is not just a demand story; it is also a timing story about when underinvestment starts to dominate efficiency gains (Reuters/MarketScreener on Goldman seeing 2026 surplus and long-run Brent/WTI near $80/$76 by late 2028; EIA, Annual Energy Outlook 2026 narrative).
| Metric | Latest read | Why it matters |
|---|---|---|
| Long-horizon anchor | Long-run demand versus long-run supply discipline | 2035 forecasts depend more on structural regime than on current prompt tightness |
| EIA signal | Brent below $70 real 2025 dollars through 2030 | Suggests long-run official caution rather than runaway supercycle pricing |
| OPEC signal | Demand rises to 113.3 mb/d by 2030 | Implies oil remains deeply embedded in the global energy mix |
| Goldman signal | WTI estimate cut to $71 for 2030-2035 | Private-sector signpost for a moderated but not collapsed equilibrium |
| Period marker | Approximate price | Interpretation |
|---|---|---|
| June 2016 monthly close | $48.33/bbl | WTI started the visible 10-year band in the high $40s as shale was still absorbing the 2014-2016 crash. |
| April 2020 monthly close | $18.84/bbl | The pandemic collapse shows how violently oil can break when storage, mobility, and sentiment all fail at once. |
| March 2022 monthly close | $100.28/bbl | Russia's invasion of Ukraine pushed crude back into a geopolitical scarcity regime. |
| December 2025 monthly close | $57.42/bbl | Before the 2026 supply shock, the market had already repriced toward oversupply and weaker demand expectations. |
| May 18, 2026 close | $103.37/bbl | Current scenarios start from an elevated, disruption-driven base rather than a neutral equilibrium. |
03. Main Drivers
Main drivers of price movement
1. Demand may grow more slowly, but decline is not yet the base case everywhere
OPEC still projects global oil demand increasing from 103.7 mb/d in 2024 to 113.3 mb/d by 2030 and almost 123 mb/d by 2050, driven mostly by non-OECD economies. EIA is more conservative, but even its narrative does not assume an immediate collapse in oil relevance. That means 2035 is more likely to be about slower growth and changing composition than outright irrelevance (OPEC, World Oil Outlook 2025, oil demand chapter; EIA, Annual Energy Outlook 2026 narrative).
2. Decline rates and underinvestment can still dominate the long run
Long-dated oil prices exist to ration demand and finance new supply. Goldman cut its 2030-2035 long-run assumptions, but even that note still argued a recovery toward higher long-run prices is needed to support investment after years of low long-cycle spending. The bear case only really works if long-run supply proves much more elastic than recent capex history suggests (Investing.com summary of Goldman Sachs cutting 2030-2035 Brent and WTI estimates to $75 and $71; Reuters/MarketScreener on Goldman seeing 2026 surplus and long-run Brent/WTI near $80/$76 by late 2028).
3. OPEC strategy gets more important, not less, over longer horizons
If non-OPEC supply matures and U.S. shale growth plateaus, OPEC's market-management power can increase even in a slower-demand world. OPEC's own supply chapter still sees U.S. liquids peaking around 2030 and non-DoC supply flattening in the mid-2030s, which is exactly the kind of backdrop that can support a firmer 2035 clearing price (OPEC, World Oil Outlook 2025, liquids supply chapter; OPEC, World Oil Outlook 2025).
4. AI, petrochemicals, aviation, and heavy transport complicate the simple 'EVs kill oil' narrative
IEA's 2026 Global Energy Review notes that petrochemical feedstocks accounted for much of China's oil-demand increase, while aviation demand was still rising. Oil demand in 2035 may therefore be less passenger-car-centric and more concentrated in sectors that are harder to substitute quickly (IEA, Global Energy Review 2026: Oil; IMF, Commodity Special Feature: market developments and the impact of AI on energy demand).
5. Real versus nominal pricing can confuse long-run debates
EIA's AEO discussion is expressed in real 2025 dollars for Brent, while market commentary often uses current nominal frames for WTI. A 65 to 90 dollar nominal WTI base case in 2035 is not especially bullish when adjusted for inflation; it is simply a statement that oil may remain economically necessary even in a more efficient energy system (EIA, Annual Energy Outlook 2026 narrative; EIA, Annual Energy Outlook 2026 reference tables).
04. Institutional Forecasts and Analyst Views
Institutional forecasts and analyst views
Long-dated institutional forecasts are scarce, and that scarcity itself is a useful signal. Credible organizations tend to publish demand and supply corridors, not precise 2035 WTI spot numbers, because small assumption changes create large terminal-price differences. The clearest current long-run public signposts are EIA's AEO narrative, OPEC's World Oil Outlook, and Goldman's reduced 2030-2035 oil assumptions (EIA, Annual Energy Outlook 2026 narrative; OPEC, World Oil Outlook 2025; Investing.com summary of Goldman Sachs cutting 2030-2035 Brent and WTI estimates to $75 and $71).
That source mix supports a wide scenario map. EIA leans toward a lower real-price world than many oil bulls prefer. OPEC leans toward stronger demand than many decarbonization models prefer. Goldman sits somewhere in between: not structurally bearish enough to call for cheap oil forever, but not willing to pay old-cycle scarcity multiples either.
| Source | Forecast / signal | Interpretation |
|---|---|---|
| EIA AEO 2026 | Brent stays below $70 real 2025 dollars through 2030 and rises above $75 in the late 2030s | Official long-run U.S. benchmark for a gradual rather than explosive price path |
| OPEC World Oil Outlook 2025 | Demand reaches 113.3 mb/d by 2030 and almost 123 mb/d by 2050 | Most structurally bullish mainstream demand view in the source set |
| Goldman Sachs | WTI estimate cut to about $71 for 2030-2035 | Suggests a moderated long-run equilibrium, not a crash |
| World Bank | 2027 Brent reverts to $70 in the base case after the 2026 shock | Reminds investors not to anchor long-run forecasts on a crisis year |
| EIA STEO | WTI averages $74.39 in 2027 | Near-term glide path that can serve as a bridge into longer-horizon scenario design |
| IEA | Current shocks are destroying some 2026 demand even while tightening supply | Long-run oil needs may still coexist with near-term volatility and demand-saving behavior |
05. Bull, Bear, and Base Case
How the forecast range and probability table are built
The 2035 framework leans more heavily on structural energy-system evidence than on prompt market balances. It asks what kind of price range can clear a world where oil demand is still substantial, upstream spending remains cyclical, and supply growth is less obviously abundant than it looked during the strongest years of shale expansion.
The probability table uses longer-horizon questions. Does demand plateau gently or fall sharply? Does OPEC gain or lose control over the marginal barrel? Do AI, petrochemicals, and emerging-market mobility partially offset transport electrification? And does capital discipline keep future supply tighter than surface-level demand models imply?
| Scenario | Price range | Conditions | Probability |
|---|---|---|---|
| Bull | $95-$130/bbl | Demand proves more resilient than expected, OPEC retains pricing power, and long-cycle underinvestment collides with maturing non-OPEC supply | 25% |
| Base | $65-$90/bbl | Oil remains essential but not scarce enough to sustain permanent crisis pricing | 50% |
| Bear | $45-$65/bbl | Efficiency gains, EV adoption, weaker demand growth, and a better-than-expected supply response hold prices in a lower equilibrium | 25% |
| Direction | Probability | Comment |
|---|---|---|
| Higher than current long-run consensus | 35% | Possible if OPEC+ power and decline rates matter more than demand erosion |
| Lower than current long-run consensus | 25% | Requires more elastic supply or much weaker demand than OPEC assumes |
| High but range-bound | 40% | The most realistic long-run path if oil stays important without re-entering a permanent supercycle |
| Investor type | Prudent approach | Main watchpoints |
|---|---|---|
| Investor already in profit | Consider holding a core allocation but trim into sharp spikes, especially when spot prices outrun medium-term fundamentals. | Watch whether prompt risk premium is fading faster than the narrative. |
| Investor currently at a loss | Reassess position size and thesis rather than averaging automatically. A cyclical commodity can stay volatile longer than expected. | Separate the long-term oil thesis from an entry-price mistake. |
| Investor with no position | Avoid chasing parabolic moves. Wait for pullbacks, stagger entries, or stay patient if the risk-reward no longer compensates for volatility. | High spot prices often compress future returns. |
| Trader | Use stop-loss discipline, monitor inventory data, OPEC+ signaling, and time spreads, and treat headlines as catalysts rather than investment theses. | WTI can overshoot both up and down when positioning becomes crowded. |
| Long-term investor | Dollar-cost averaging can make sense only if you accept long drawdowns and use a horizon long enough to absorb policy and macro cycles. | Long-run oil exposure should be sized as a cyclical asset, not a bond substitute. |
| Risk-hedging investor | Use crude as part of a broader inflation or geopolitical hedge basket, and rebalance when one shock turns a hedge into an outsized directional bet. | Oil can hedge some macro risks while creating others. |
WTI in 2035 is best framed as a contest between declining oil intensity and declining easy supply. If investors assume only one side of that equation matters, the forecast will likely be too extreme. The center of gravity still points to oil remaining economically relevant and periodically tight, but not necessarily permanently stuck above 100 dollars. Disclaimer: This article is for informational and research purposes only and does not constitute personalized financial advice.
06. FAQ
Frequently asked questions
Is triple-digit WTI in 2035 plausible?
Yes, but it is better treated as a conditional bull case than as a base case. It would likely require stronger demand resilience and tighter supply than most current central scenarios assume.
Why is the base case lower than the bull headlines?
Because many bull headlines extrapolate current disruption-driven pricing. A 2035 base case has to allow for normalization, substitution, and investment response.
What is the strongest long-run bullish source in this set?
OPEC's demand outlook is the clearest structural bull input because it still sees robust growth to 2030 and beyond.
What would invalidate the constructive long-run view?
A much flatter demand path, faster electrification, or surprisingly strong non-OPEC supply growth would all weaken the 2035 case materially.
Methodology and Invalidation
How to interpret this framework and what would change it
This article uses long-run structural signposts rather than relying mainly on one-year bank forecasts. The most important inputs are EIA's AEO 2026 narrative, OPEC's World Oil Outlook 2025, Goldman's published long-run estimate coverage, and shorter-dated normalization anchors from EIA and the World Bank (EIA, Annual Energy Outlook 2026 narrative; OPEC, World Oil Outlook 2025; Investing.com summary of Goldman Sachs cutting 2030-2035 Brent and WTI estimates to $75 and $71; EIA, STEO current/previous forecast comparisons, May 12, 2026; World Bank, Commodity Markets Outlook, April 2026).
The range therefore reflects structural uncertainty, not analytical weakness. When a market's long-run price depends on technology adoption, OPEC behavior, depletion, and capex, precision is usually fake. Range-based reasoning is the more rigorous approach.
Invalidation would come from either direction. Faster demand destruction and more abundant supply would lower the range. Persistent underinvestment, higher decline rates, and stronger demand in hard-to-electrify sectors would raise it.
References
Sources
- Yahoo Finance chart API, CL=F 10-year monthly data
- EIA, STEO current/previous forecast comparisons, May 12, 2026
- EIA, Annual Energy Outlook 2026 narrative
- EIA, Annual Energy Outlook 2026 reference tables
- IEA, Oil Market Report, May 2026
- IEA, Global Energy Review 2026: Oil
- World Bank, Commodity Markets Outlook, April 2026
- OPEC, World Oil Outlook 2025
- OPEC, World Oil Outlook 2025, oil demand chapter
- OPEC, World Oil Outlook 2025, liquids supply chapter
- IMF, Commodity Special Feature: market developments and the impact of AI on energy demand
- Investing.com summary of Goldman Sachs cutting 2030-2035 Brent and WTI estimates to $75 and $71
- Reuters/MarketScreener on Goldman seeing 2026 surplus and long-run Brent/WTI near $80/$76 by late 2028