01. Quick Answer
WTI Oil Analysis: 2030 Price Prediction and Macro Outlook
The quick answer is that a disciplined 2030 WTI forecast should sit below the current spot price but above the pre-shock consensus that dominated late 2025. Available data suggests today's 103 dollar handle contains a large geopolitical premium, while medium-term official baselines are still materially lower. EIA's May 2026 STEO puts WTI at 85.68 dollars on average in 2026 and 74.39 dollars in 2027, while the World Bank still expects Brent to revert from 86 dollars in 2026 to 70 dollars in 2027 under a partial normalization scenario (EIA, STEO current/previous forecast comparisons, May 12, 2026; World Bank, Commodity Markets Outlook, April 2026).
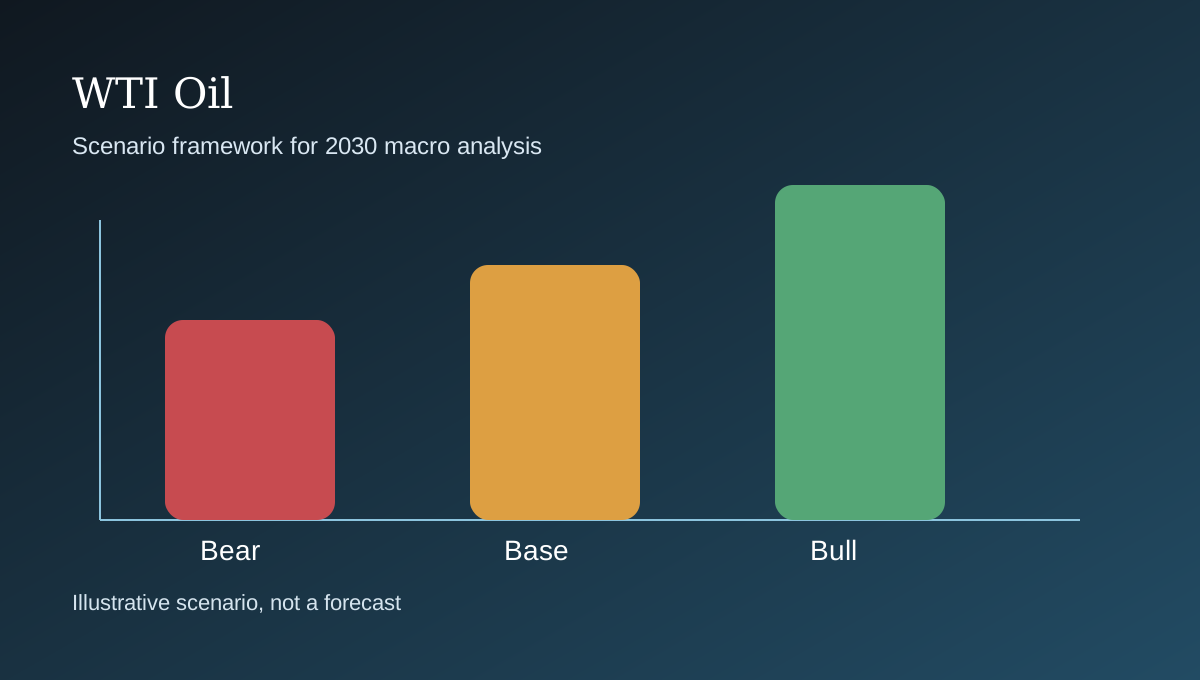
A reasonable editorial 2030 framework is 60 to 80 dollars per barrel in the base case, 85 to 110 in the bull case, and 40 to 60 in the bear case. That range reflects three competing truths. First, current prices are inflated by an acute 2026 supply shock. Second, EIA's long-run narrative still points to Brent staying below 70 dollars in real 2025 dollars through 2030. Third, OPEC still sees global oil demand rising to 113.3 million barrels per day by 2030, which limits how aggressively long-run oil can be written off (EIA, Annual Energy Outlook 2026 narrative; OPEC, World Oil Outlook 2025, oil demand chapter; Investing.com summary of Goldman Sachs cutting 2030-2035 Brent and WTI estimates to $75 and $71).
| Category | Evidence-based read | Implication |
|---|---|---|
| Historical data | WTI has traded between 18.84 and 105.76 dollars over the past decade. | Any 2030 view needs scenario ranges, not a single heroic target. |
| Current market conditions | Spot WTI near 103 dollars reflects disruption-driven tightness, not a settled equilibrium. | High current prices do not automatically extrapolate to 2030. |
| Institutional evidence | EIA, World Bank, IEA, OPEC, and Goldman point to mixed signals rather than one clean direction. | The evidence is strongest for a volatile medium-term normalization path. |
| Most important variable | The balance between OPEC+ spare capacity, non-OPEC supply growth, and demand resilience will decide the clearing range. | Macro and geopolitics matter as much as pure cost curves. |
02. Historical Context
Current market snapshot and historical context
WTI's 10-year range of $18.84 to $105.76 per barrel is the first reason any forecast has to be scenario-based rather than point-based. Oil is not a stable compounder. It is a clearing price for a system shaped by geology, OPEC+ policy, inventories, freight constraints, war risk, and global growth. The same benchmark that collapsed in 2020 recovered above $100 in both 2022 and 2026, which means investors should distinguish between a correction, a cyclical bear market, and a structurally lower oil regime (Yahoo Finance chart API, CL=F 10-year monthly data; IEA, Global Energy Review 2026: Oil).
A second historical point matters for 2030 specifically: in late 2025 WTI monthly closes were already down in the high $50s before the 2026 Middle East shock. In other words, the market itself just demonstrated how quickly it can move from surplus logic to scarcity logic. That matters because 2030 may not look like a straight line from today's price. It may look like several mini-cycles stitched together by OPEC+ policy, shale productivity, refinery constraints, and energy-transition frictions (Yahoo Finance chart API, CL=F 10-year monthly data; OPEC, Monthly Oil Market Report demand table; IMF, World Economic Outlook, April 2026).
| Metric | Latest read | Why it matters |
|---|---|---|
| Spot context | $103.37/bbl on May 18, 2026 | Anchors every future scenario in the actual market rather than a stale consensus |
| 1-month range | $89.61-$106.88/bbl | Shows how much event risk is already embedded in near-term crude pricing |
| 10-year low/high | $18.84 / $105.76 | Frames both crash risk and upside ceiling using observed market history |
| EIA 2027 average | $74.39/bbl | A useful official benchmark for post-shock normalization |
| Period marker | Approximate price | Interpretation |
|---|---|---|
| June 2016 monthly close | $48.33/bbl | WTI started the visible 10-year band in the high $40s as shale was still absorbing the 2014-2016 crash. |
| April 2020 monthly close | $18.84/bbl | The pandemic collapse shows how violently oil can break when storage, mobility, and sentiment all fail at once. |
| March 2022 monthly close | $100.28/bbl | Russia's invasion of Ukraine pushed crude back into a geopolitical scarcity regime. |
| December 2025 monthly close | $57.42/bbl | Before the 2026 supply shock, the market had already repriced toward oversupply and weaker demand expectations. |
| May 18, 2026 close | $103.37/bbl | Current scenarios start from an elevated, disruption-driven base rather than a neutral equilibrium. |
03. Main Drivers
Main drivers of price movement
1. OPEC+ spare capacity still matters more than almost any other lever
IEA's May 2026 report shows world oil demand contracting by 420 thousand barrels per day in 2026 because the current shock is destroying consumption even as it constrains supply. But it also shows how decisive Gulf outages and spare-capacity assumptions remain for price formation. When spare capacity is perceived as thin, oil trades like a shortage asset. When OPEC+ supply is visibly returning, it trades more like an inventory asset (IEA, Oil Market Report, May 2026; EIA press release, forecast update amid continued Middle East disruption, May 12, 2026).
2. U.S. shale is still a stabilizer, but not the old one-way deflation machine
OPEC's 2025 World Oil Outlook still expects U.S. tight oil to remain the key contributor to non-OPEC supply growth through 2030, while EIA's AEO 2026 notes that U.S. crude production stays in a relatively narrow range across most cases. That suggests shale can cap extreme bull markets, but it may no longer crush every rally the way it did in the late 2010s (OPEC, World Oil Outlook 2025, liquids supply chapter; EIA, Annual Energy Outlook 2026 narrative).
3. Demand destruction and EV penetration are real, but so is non-OECD demand resilience
EIA's long-run view and many macro investors focus on transport efficiency, EV adoption, and slower petroleum intensity growth. OPEC takes the other side more aggressively, expecting global demand at 113.3 mb/d by 2030, driven mainly by non-OECD countries. Available data therefore suggests the 2030 demand debate is less about whether growth slows and more about whether it slows enough to offset natural field decline and underinvestment (EIA, Annual Energy Outlook 2026 narrative; OPEC, World Oil Outlook 2025, oil demand chapter; IEA, Global Energy Review 2026: Oil).
4. Inventories and time spreads will keep deciding whether scarcity is real or mostly narrative
EIA's May 2026 update and IEA's latest market note both frame inventories as the transmission mechanism between supply shocks and price. Oil can trade expensively for a while on fear alone, but a 2030 thesis must be grounded in whether commercial stocks and spare capacity stabilize or remain chronically tight (EIA, Short-Term Energy Outlook, May 2026; IEA, Oil Market Report, May 2026).
5. Fiscal stress and underinvestment can support a structurally higher floor
Goldman cut its 2030-2035 long-run oil assumptions to 75 dollars Brent and 71 dollars WTI, which is not a super-bullish call. But even that reduced long-run view still sits above late-2025 spot levels. The implication is that years of low long-cycle investment and natural decline still require a meaningful price floor even in a less oil-intensive world (Investing.com summary of Goldman Sachs cutting 2030-2035 Brent and WTI estimates to $75 and $71; Reuters/MarketScreener on Goldman seeing 2026 surplus and long-run Brent/WTI near $80/$76 by late 2028).
04. Institutional Forecasts and Analyst Views
Institutional forecasts and analyst views
Institutional forecasts do not support a single confident 2030 WTI number. Short-term official forecasts remain dominated by the 2026 shock, while long-term outlooks often discuss Brent, demand, and supply corridors rather than a clean WTI point target. That is exactly why a scenario framework is more defensible than pretending one model can solve the whole decade (EIA, STEO current/previous forecast comparisons, May 12, 2026; EIA, Annual Energy Outlook 2026 narrative; OPEC, World Oil Outlook 2025).
The current source set splits into three camps. EIA's medium-term baseline implies substantial normalization from current levels. OPEC's structural outlook remains more constructive on demand. Private-sector banks such as Goldman acknowledge both near-term two-sided risk and a lower long-run equilibrium than many bulls assume. Analysts remain divided because 2030 sits beyond the reach of today's geopolitical premium but still inside the window where underinvestment may bite (Reuters on Goldman Sachs keeping 2026 Brent and WTI forecasts at $83 and $78; Investing.com summary of Goldman Sachs cutting 2030-2035 Brent and WTI estimates to $75 and $71; World Bank, Commodity Markets Outlook, April 2026).
| Source | Forecast / signal | Interpretation |
|---|---|---|
| EIA STEO | WTI averages $85.68 in 2026 and $74.39 in 2027 | Official baseline favors normalization from current spot levels |
| World Bank | Brent averages $86 in 2026 then $70 in 2027 | Energy-shock premium fades in the base scenario |
| Goldman Sachs | 2026 WTI forecast held at $78; long-run 2030-2035 WTI cut to $71 | Private-sector signpost for a lower but still positive real floor |
| OPEC | Demand reaches 113.3 mb/d by 2030 | Structural demand resilience supports higher floors than deep-decline narratives assume |
| EIA AEO 2026 | Brent remains below $70 in real 2025 dollars through 2030 | Long-run U.S. official view remains cautious on price upside |
| IEA | 2026 demand contracts to 104 mb/d because of the current shock | Near-term tightness can coexist with macro-sensitive demand destruction |
05. Bull, Bear, and Base Case
How the forecast range and probability table are built
This range is editorial and scenario-based rather than a promise about where WTI must trade in December 2030. It starts with current spot conditions, then strips out some of today's disruption premium while allowing for the possibility that OPEC+ discipline, non-OECD demand, and slower-than-expected non-OPEC supply growth keep oil structurally firmer than late-2025 consensus implied.
The probability table below is built from four questions. Does the 2026 shock normalize quickly? Does long-run demand hold up better than many energy-transition models assume? Can shale and non-OPEC supply keep capping rallies? And do inventories return to a comfortable range or remain structurally tight? Those variables matter more than any one-month price spike.
| Scenario | Price range | Conditions | Probability |
|---|---|---|---|
| Bull | $85-$110/bbl | OPEC+ keeps spare capacity disciplined, non-OECD demand holds up, and underinvestment prevents a durable return to late-2025 surplus conditions | 30% |
| Base | $60-$80/bbl | The 2026 premium fades, but oil still clears above the pre-shock floor because demand proves sticky and supply growth is adequate rather than overwhelming | 45% |
| Bear | $40-$60/bbl | Demand disappoints, OPEC+ cohesion weakens, and non-OPEC supply plus efficiency gains push the market back toward durable surplus | 25% |
| Direction | Probability | Comment |
|---|---|---|
| Higher than late-2025 regime | 40% | A reasonable outcome if the floor has shifted up but the current spike still cools |
| Lower than today | 35% | Current spot already embeds a large risk premium that may not survive to 2030 |
| Sideways but volatile | 25% | Oil often mean-reverts in level while remaining unstable in path |
| Investor type | Prudent approach | Main watchpoints |
|---|---|---|
| Investor already in profit | Consider holding a core allocation but trim into sharp spikes, especially when spot prices outrun medium-term fundamentals. | Watch whether prompt risk premium is fading faster than the narrative. |
| Investor currently at a loss | Reassess position size and thesis rather than averaging automatically. A cyclical commodity can stay volatile longer than expected. | Separate the long-term oil thesis from an entry-price mistake. |
| Investor with no position | Avoid chasing parabolic moves. Wait for pullbacks, stagger entries, or stay patient if the risk-reward no longer compensates for volatility. | High spot prices often compress future returns. |
| Trader | Use stop-loss discipline, monitor inventory data, OPEC+ signaling, and time spreads, and treat headlines as catalysts rather than investment theses. | WTI can overshoot both up and down when positioning becomes crowded. |
| Long-term investor | Dollar-cost averaging can make sense only if you accept long drawdowns and use a horizon long enough to absorb policy and macro cycles. | Long-run oil exposure should be sized as a cyclical asset, not a bond substitute. |
| Risk-hedging investor | Use crude as part of a broader inflation or geopolitical hedge basket, and rebalance when one shock turns a hedge into an outsized directional bet. | Oil can hedge some macro risks while creating others. |
WTI's 2030 outlook is neither permanently bearish nor cleanly bullish. The current market is too tight to dismiss oil as yesterday's asset, but it is also too distorted to extrapolate 103 dollar crude all the way to the end of the decade. The most defensible stance is a scenario range centered well below today's price but still above the low-surplus expectations that dominated before the 2026 shock. Disclaimer: This article is for informational and research purposes only and does not constitute personalized financial advice.
06. FAQ
Frequently asked questions
What is the most defensible WTI price outlook for 2030?
A range is more defensible than a single target. The editorial base case here is 60 to 80 dollars per barrel because current prices look too elevated to extrapolate, but long-run supply and demand still argue against a return to structurally cheap oil.
Why is the base case below today's WTI price?
Because today's spot price includes a meaningful 2026 geopolitical risk premium. A 2030 forecast should incorporate the possibility that this premium fades even if oil stays structurally important.
What is the main bull-case driver into 2030?
The strongest bull argument is that OPEC+ discipline, underinvestment, and resilient non-OECD demand keep inventories tighter than the market expects.
What would invalidate this 2030 framework?
A persistent surplus, materially weaker demand, or a much stronger non-OPEC supply response would all argue for lower 2030 ranges.
Methodology and Invalidation
How to interpret this framework and what would change it
This article combines current WTI pricing, the 10-year monthly trading band, EIA's May 2026 short-term path, the World Bank's 2026-2027 energy baseline, OPEC's 2030 demand outlook, and EIA's longer-run AEO narrative (Yahoo Finance chart API, CL=F recent daily data; Yahoo Finance chart API, CL=F 10-year monthly data; EIA, STEO current/previous forecast comparisons, May 12, 2026; World Bank, Commodity Markets Outlook, April 2026; OPEC, World Oil Outlook 2025, oil demand chapter; EIA, Annual Energy Outlook 2026 narrative).
The forecast range is not derived from one statistical model. It is a judgment-based framework anchored to observable market history and competing institutional assumptions. The goal is to show which variables are doing the analytical heavy lifting rather than to fake precision.
What would change the view? A faster demand slowdown, a clear break in OPEC+ cohesion, or much stronger U.S. and non-OPEC supply growth would move the base case down. Conversely, if inventories remain persistently tight and long-cycle investment stays weak, the bull case would become more credible than it looks today.
References
Sources
- Yahoo Finance chart API, CL=F recent daily data
- Yahoo Finance chart API, CL=F 10-year monthly data
- EIA, STEO current/previous forecast comparisons, May 12, 2026
- EIA, Short-Term Energy Outlook, May 2026
- EIA press release, forecast update amid continued Middle East disruption, May 12, 2026
- EIA, Annual Energy Outlook 2026 narrative
- IEA, Oil Market Report, May 2026
- World Bank, Commodity Markets Outlook, April 2026
- OPEC, World Oil Outlook 2025, oil demand chapter
- OPEC, World Oil Outlook 2025, liquids supply chapter
- OPEC, Monthly Oil Market Report demand table
- IMF, World Economic Outlook, April 2026
- Reuters on Goldman Sachs keeping 2026 Brent and WTI forecasts at $83 and $78
- Investing.com summary of Goldman Sachs cutting 2030-2035 Brent and WTI estimates to $75 and $71
- Reuters/MarketScreener on Goldman seeing 2026 surplus and long-run Brent/WTI near $80/$76 by late 2028