01. Quick Answer
WTI Prediction for 2027: Supply, Demand, and Price Risks
The quick answer is that 2027 looks more like a normalization year than a crisis year unless current supply disruptions prove much more persistent than most official forecasts assume. EIA's detailed May 2026 table shows WTI easing from 83 dollars in 4Q26 to 78.95, 76, 73, and 70 by quarter through 2027, for a 74.39 annual average (EIA, STEO current/previous forecast comparisons, May 12, 2026).
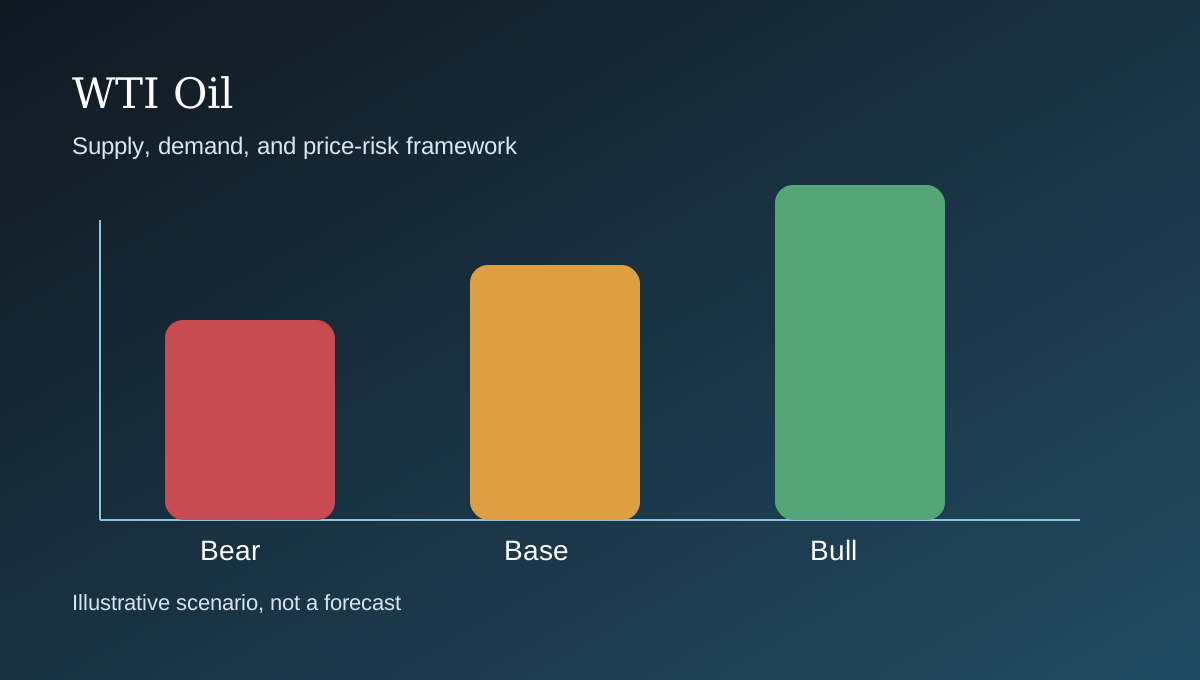
A balanced 2027 editorial range is 68 to 80 dollars per barrel in the base case, 85 to 100 in the bull case, and 50 to 68 in the bear case. The base case stays above late-2025 pricing because underinvestment and OPEC+ management still matter, but it stays far below today's spot because the current price still looks heavily influenced by disruption, low spare capacity, and security premium (World Bank, Commodity Markets Outlook, April 2026; IEA, Oil Market Report, May 2026; Reuters on Goldman Sachs keeping 2026 Brent and WTI forecasts at $83 and $78).
| Category | Evidence-based read | Implication |
|---|---|---|
| Near-term anchor | EIA's 2027 average of 74.39 dollars is the cleanest official WTI benchmark available today. | It should be the starting point for any 2027 debate. |
| Current market distortion | Spot above 100 dollars embeds more shock premium than the 2027 base case can comfortably justify. | Chasing current prices into 2027 requires a stronger disruption thesis. |
| Main risks | OPEC+ discipline, inventory draws, supply recovery, and demand destruction all remain live variables. | 2027 is still mostly a balance-sheet and logistics story. |
| Investor implication | The probability of volatility is higher than the probability of a stable one-way trend. | Position sizing matters as much as directional view. |
02. Historical Context
Current market snapshot and historical context
WTI's 10-year range of $18.84 to $105.76 per barrel is the first reason any forecast has to be scenario-based rather than point-based. Oil is not a stable compounder. It is a clearing price for a system shaped by geology, OPEC+ policy, inventories, freight constraints, war risk, and global growth. The same benchmark that collapsed in 2020 recovered above $100 in both 2022 and 2026, which means investors should distinguish between a correction, a cyclical bear market, and a structurally lower oil regime (Yahoo Finance chart API, CL=F 10-year monthly data; IEA, Global Energy Review 2026: Oil).
For 2027, the most important historical marker is not 2016 or even 2022 by itself. It is the fact that WTI traded at 57.42 dollars in December 2025 and above 100 dollars again in May 2026. That round trip inside a few months shows how much of the current market is about event risk rather than settled medium-term fundamentals (Yahoo Finance chart API, CL=F 10-year monthly data; EIA press release, forecast update amid continued Middle East disruption, May 12, 2026).
| Metric | Latest read | Why it matters |
|---|---|---|
| Spot WTI | $103.37/bbl | Current reference point for every 2027 scenario |
| 1-month range | $89.61-$106.88/bbl | Shows how unstable prompt pricing remains |
| EIA 2027 quarter path | $78.95, $76, $73, $70 | Official glide path toward normalization |
| World Bank 2027 Brent | $70/bbl | Confirms that mainstream institutions still expect lower prices once the shock fades |
| Period marker | Approximate price | Interpretation |
|---|---|---|
| June 2016 monthly close | $48.33/bbl | WTI started the visible 10-year band in the high $40s as shale was still absorbing the 2014-2016 crash. |
| April 2020 monthly close | $18.84/bbl | The pandemic collapse shows how violently oil can break when storage, mobility, and sentiment all fail at once. |
| March 2022 monthly close | $100.28/bbl | Russia's invasion of Ukraine pushed crude back into a geopolitical scarcity regime. |
| December 2025 monthly close | $57.42/bbl | Before the 2026 supply shock, the market had already repriced toward oversupply and weaker demand expectations. |
| May 18, 2026 close | $103.37/bbl | Current scenarios start from an elevated, disruption-driven base rather than a neutral equilibrium. |
03. Main Drivers
Main drivers of price movement
1. Supply recovery timing is the biggest single 2027 variable
EIA's May 2026 forecast explicitly depends on resumed flows through the Strait of Hormuz and the rate at which shut-in production comes back. If that recovery slips, 2027 averages move up. If it normalizes faster, 2027 could undershoot the official path (EIA press release, forecast update amid continued Middle East disruption, May 12, 2026; EIA, Short-Term Energy Outlook, May 2026).
2. OPEC+ can defend price, but only within demand limits
OPEC's monthly demand table still points to robust 2026 demand in its core scenario, while the IEA sees a 2026 contraction under current conditions. That divergence matters because a tight 2027 outcome needs either firmer demand than the IEA assumes or stricter supply management than the market currently prices (OPEC, Monthly Oil Market Report demand table; IEA, Oil Market Report, May 2026).
3. Non-OPEC supply remains the main bearish offset
JPMorgan's early-2026 oversupply call and Goldman's surplus framing both underscore the same point: outside a major disruption, the market still has a supply-growth story. That is why the bearish case for 2027 is easier to defend than the bearish case for 2035 (Investing.com summary of JPMorgan seeing oil oversupply in 2026; Reuters/MarketScreener on Goldman seeing 2026 surplus and long-run Brent/WTI near $80/$76 by late 2028).
4. Demand destruction becomes more visible when oil stays expensive
IEA's latest note already shows higher prices and weaker macro conditions affecting petrochemicals and aviation in 2026. If crude remains too high for too long, the market eventually solves part of the problem through slower use rather than only through more supply (IEA, Oil Market Report, May 2026; IMF, World Economic Outlook, April 2026).
5. The Brent-WTI spread matters for interpreting WTI itself
EIA's 2026 tables show a wide Brent-WTI spread during the disruption period. A narrower spread in 2027 could pressure WTI even if Brent stays relatively firm, which means U.S.-centric investors should not read broad oil strength as a one-for-one WTI story (EIA, STEO current/previous forecast comparisons, May 12, 2026; EIA, Short-Term Energy Outlook, May 2026).
04. Institutional Forecasts and Analyst Views
Institutional forecasts and analyst views
2027 is one of the few horizons where there is meaningful institutional overlap. EIA has a full quarterly WTI path. The World Bank has a 2027 Brent baseline. Goldman, JPMorgan, and other banks have post-shock views that help frame how much of the current market they think can persist (EIA, STEO current/previous forecast comparisons, May 12, 2026; World Bank, Commodity Markets Outlook, April 2026; Reuters on Goldman Sachs keeping 2026 Brent and WTI forecasts at $83 and $78; Investing.com summary of JPMorgan seeing oil oversupply in 2026).
Taken together, those views imply that 2027 is unlikely to be a clean return to 50-dollar oil unless demand weakens materially or non-OPEC supply surprises on the upside. But they also imply that sustaining current 100-dollar conditions into 2027 would require a stronger and longer disruption regime than most baseline forecasts currently assume.
| Source | Forecast / signal | Interpretation |
|---|---|---|
| EIA STEO | WTI averages $74.39 in 2027 | Most useful official WTI benchmark |
| World Bank | Brent averages $70 in 2027 | Supports a post-shock easing narrative |
| Goldman Sachs | 2026 WTI forecast held at $78 | Suggests the bank sees normalization, not endless upside |
| JPMorgan | 2026 can swing between oversupply and tightness depending on geopolitics | Useful reminder that 2027 inherits whichever regime wins out |
| HSBC / Barclays / Citi | Recent bank upgrades were tied to 2026 disruption persistence | Bullish revisions are event-driven, not necessarily durable 2027 equilibrium calls |
| IEA / OPEC | Demand disagreement remains wide | 2027 price risk still hinges on which demand model proves closer to reality |
05. Bull, Bear, and Base Case
How the forecast range and probability table are built
The range below begins with EIA's 74.39-dollar annual average and then widens around it based on what could go wrong or right. That makes the framework transparent: the official baseline is the anchor, not an afterthought.
The probability split uses short-to-medium-term variables rather than decade-scale structural ones. Supply recovery speed, OPEC+ cohesion, inventory behavior, and the durability of demand under higher prices do most of the work.
| Scenario | Price range | Conditions | Probability |
|---|---|---|---|
| Bull | $85-$100/bbl | Middle East disruptions linger, OPEC+ stays tight, and inventory draws persist into 2027 | 30% |
| Base | $68-$80/bbl | The 2026 premium fades gradually, but oil still clears above late-2025 levels | 45% |
| Bear | $50-$68/bbl | Supply normalizes faster than expected and growth softens enough to rebuild stocks | 25% |
| Direction | Probability | Comment |
|---|---|---|
| Higher than EIA's 2027 average | 35% | Requires more persistent disruption or tighter-than-expected balances |
| Lower than EIA's 2027 average | 25% | Possible if supply recovery and non-OPEC growth overshoot |
| Near EIA baseline | 40% | Still the single most defensible starting point |
| Investor type | Prudent approach | Main watchpoints |
|---|---|---|
| Investor already in profit | Consider holding a core allocation but trim into sharp spikes, especially when spot prices outrun medium-term fundamentals. | Watch whether prompt risk premium is fading faster than the narrative. |
| Investor currently at a loss | Reassess position size and thesis rather than averaging automatically. A cyclical commodity can stay volatile longer than expected. | Separate the long-term oil thesis from an entry-price mistake. |
| Investor with no position | Avoid chasing parabolic moves. Wait for pullbacks, stagger entries, or stay patient if the risk-reward no longer compensates for volatility. | High spot prices often compress future returns. |
| Trader | Use stop-loss discipline, monitor inventory data, OPEC+ signaling, and time spreads, and treat headlines as catalysts rather than investment theses. | WTI can overshoot both up and down when positioning becomes crowded. |
| Long-term investor | Dollar-cost averaging can make sense only if you accept long drawdowns and use a horizon long enough to absorb policy and macro cycles. | Long-run oil exposure should be sized as a cyclical asset, not a bond substitute. |
| Risk-hedging investor | Use crude as part of a broader inflation or geopolitical hedge basket, and rebalance when one shock turns a hedge into an outsized directional bet. | Oil can hedge some macro risks while creating others. |
WTI in 2027 is easier to frame than 2030 or 2035 because the official benchmark is stronger and the unknowns are narrower. The market can still surprise in either direction, but the evidence currently favors normalization toward a lower range than today's spot rather than a clean continuation of triple-digit crude. Disclaimer: This article is for informational and research purposes only and does not constitute personalized financial advice.
06. FAQ
Frequently asked questions
What is the official WTI forecast for 2027?
EIA's May 2026 STEO shows a 2027 average of 74.39 dollars per barrel, with quarterly averages stepping down from roughly 79 to 70 dollars through the year.
Why is the 2027 base case so much lower than today's WTI price?
Because the current price reflects a large 2026 disruption premium that most baseline scenarios do not carry forward fully into 2027.
What would push 2027 back above 90 dollars?
A slower supply recovery, tighter OPEC+ discipline, or deeper inventory draws could all do that.
What would invalidate the normalization thesis?
If the geopolitical shock becomes semi-permanent or non-OPEC supply disappoints badly, a lower 2027 base case would look too conservative.
Methodology and Invalidation
How to interpret this framework and what would change it
This 2027 framework is anchored more tightly than the 2030 and 2035 pieces because EIA provides explicit WTI quarterly and annual values through 2027 (EIA, STEO current/previous forecast comparisons, May 12, 2026; EIA, Short-Term Energy Outlook, May 2026).
The range then widens around that baseline using the World Bank's Brent path, IEA and OPEC demand views, and bank commentary on how much of the current disruption can persist (World Bank, Commodity Markets Outlook, April 2026; IEA, Oil Market Report, May 2026; OPEC, Monthly Oil Market Report demand table; Reuters on Goldman Sachs keeping 2026 Brent and WTI forecasts at $83 and $78).
Invalidation is straightforward. If 2026 disruptions normalize quickly and inventories rebuild hard, the lower half becomes more likely. If outages, low spare capacity, and demand resilience persist longer, the higher half becomes more credible.
References
Sources
- Yahoo Finance chart API, CL=F 10-year monthly data
- EIA, STEO current/previous forecast comparisons, May 12, 2026
- EIA, Short-Term Energy Outlook, May 2026
- EIA press release, forecast update amid continued Middle East disruption, May 12, 2026
- IEA, Oil Market Report, May 2026
- World Bank, Commodity Markets Outlook, April 2026
- OPEC, Monthly Oil Market Report demand table
- IMF, World Economic Outlook, April 2026
- Reuters on Goldman Sachs keeping 2026 Brent and WTI forecasts at $83 and $78
- Reuters/MarketScreener on Goldman seeing 2026 surplus and long-run Brent/WTI near $80/$76 by late 2028
- Investing.com summary of JPMorgan seeing oil oversupply in 2026
- Reuters on HSBC raising its 2026 Brent forecast to $95
- Reuters on Barclays raising its 2026 Brent forecast to $100
- Reuters summary via BOE Report on Citi's updated 2026 Brent path and extreme disruption scenario