01. Quick Answer
The most defensible 2030 gold outlook is still constructive, but the case rests on structural support rather than on a straight-line repeat of the 2025 rally
Gold futures (GC=F on Yahoo Finance) were trading around $4,545.2/oz on 2026-05-18. The same 10-year monthly series started near $1,318.4/oz on 2016-06-01 and most recently showed $4,545.2/oz, with a 10-year range of roughly $1,150.0 to $4,713.9 and a price-only CAGR near 15.51% (10-year monthly data).
For 2030, the base case is not that gold mechanically doubles from here. The base case is that the market holds a structurally higher floor than in the 2013-2019 era because reserve managers, central banks, and private investors are treating gold as a strategic asset again (WGC central-bank survey; IMF COFER Q4 2025; J.P. Morgan Global Research).
That still leaves room for meaningful volatility. Real yields were about 2.00% on 2026-05-14 in the latest FRED reading, which is a reminder that gold is structurally stronger than before but not immune to macro drag. A reasonable 2030 framework therefore needs a bull case, a bear case, and a base case instead of a single heroic estimate.
| Point | Why it matters |
|---|---|
| Historical data | Gold's 10-year monthly price range spans roughly $1,150 to $4,713.9, so wide swings are normal even inside a secular uptrend. |
| Current market conditions | Central-bank demand, reserve diversification, and debt concerns remain supportive, but real yields stay high enough to cap complacency. |
| Institutional forecasts | Major-bank and LBMA survey data support a high-price regime, yet direct 2030 point targets remain scarce and highly conditional. |
| Base-case logic | A $5.6k-$7.2k range implies moderate compounding from today's price, not another uninterrupted repricing wave. |
02. Historical Context
The 2030 question starts with how much of gold's recent rerating should be treated as structural
Gold's current regime looks different from the quiet pre-pandemic period. The World Gold Council reported 2025 total demand of 4,999.4 tonnes and total supply of 5,002.3 tonnes, while central banks still added 863.3 tonnes and ETFs contributed 801.2 tonnes of annual demand. That mix matters because it says the move was not driven by a single speculative constituency.
The latest quarterly follow-through also matters. In Q1 2026, the World Gold Council said total demand including OTC rose 2% year over year to 1,231 tonnes, central banks bought 244 tonnes on a net basis, and gold-backed ETFs still added 62 tonnes even though Western investor appetite cooled in March (Q1 2026 Gold Demand Trends).
This is why long-term gold analysis should not confuse a correction with a thesis break. A few quarters of softer flows would not erase a regime shaped by reserve diversification, higher official-sector buying, and fiscal anxiety. But it would narrow the path to the more aggressive 2030 targets.
| Metric | Latest reading | Why it matters |
|---|---|---|
| Current gold price | $4,545.2/oz | Every long-range forecast needs a current anchor rather than an outdated cycle low. |
| 52-week range | $3,207.5 to $5,586.2 | Shows how much of the safe-haven and reserve-diversification story is already in the price. |
| 10-year monthly range | $1,150.0 to $4,713.9 | Useful for separating a normal correction from a genuine regime break. |
| 10-year price CAGR | 15.51% | A high recent compounding rate is a warning against naive straight-line extrapolation. |
| 10-year real yield | 2.00% on 2026-05-14 | Real yields remain one of the cleanest cyclical headwinds or tailwinds for a non-yielding asset. |
| Editorial base range | $5.6k-$7.2k | Scenario ranges are more defensible than a single number for a macro asset. |
| Line item | Latest official reading | Interpretation |
|---|---|---|
| 2025 total demand | 4,999.4t | Demand stayed broad even after gold entered a much higher price regime. |
| 2025 total supply | 5,002.3t | Supply kept up in aggregate, but only with help from recycling and modest mine growth. |
| 2025 mine production | 3,671.6t | Mine output inched higher, but not enough to invalidate the scarcity argument. |
| 2025 recycled gold | 1,404.3t | Higher prices encouraged more scrap, yet not a flood of secondary supply. |
| 2025 central-bank demand | 863.3t | Below 2024, but still far above the 2010-2021 average cited by WGC. |
| Q1 2026 central-bank demand | 244t | Official buying remained resilient even after gold touched record territory. |
| Q1 2026 ETF flows | +62t | Positive inflows continued, but at a slower rate than the prior risk-off surge. |
| Q1 2026 technology demand | 81.6t | Industrial demand remains a small but real part of the gold story. |
03. Main Drivers
Five forces will decide whether gold merely stays expensive or enters another structural leg higher into 2030
1. Reserve diversification remains slow, but it is no longer hypothetical
The IMF's Q4 2025 COFER brief showed the U.S. dollar at 56.77% of allocated reserves. That is still dominant, but the direction remains lower, and the World Gold Council's 2025 central-bank survey said 73% of respondents expect the dollar's reserve share to be lower in five years (IMF COFER; WGC survey).
2. Central-bank buying still acts like a structural floor
WGC's 2025 survey found 95% of respondents expect global central-bank gold reserves to rise over the next 12 months and 43% expect their own institution to buy more. That does not mean official buyers are price-insensitive, but it does mean the market retains a strategic bid that did not exist in many earlier cycles.
3. Supply growth is positive, not explosive
WGC estimated 2025 mine production at 3,671.6 tonnes and recycled gold at 1,404.3 tonnes, while the USGS estimated global mine production around 3,300 tonnes in 2025. Those figures show supply can respond, yet only slowly, and not in a way that automatically overwhelms demand at current prices (WGC supply data; USGS 2026 summary).
4. Real yields and the dollar remain the cleanest macro brake
Gold is still a non-yielding asset. That is why the latest FRED real-yield reading near 2.00% matters so much. If real yields stay near 2% or move higher while the dollar firms, gold may hold a higher floor yet still struggle to compound aggressively.
5. Fiscal stress and broader investor ownership support a higher long-run floor
The Congressional Budget Office still projects debt held by the public to move above its previous historical peak by 2029, while J.P. Morgan and WGC both frame gold as a portfolio diversifier in a world of wider fiscal deficits, larger reserve-management uncertainty, and less reliable stock-bond hedging (CBO; J.P. Morgan Private Bank; WGC cross-asset view).
04. Institutional Forecasts and Analyst Views
Institutional evidence supports a higher floor for gold, but not universal agreement on how far that rerating can run by 2030
Direct 2030 gold targets from top-tier institutions remain limited, so the most useful approach is to treat medium-term bank forecasts as anchor points rather than as final answers. J.P. Morgan Global Research forecasts gold to average $5,055 in Q4 2026 and move toward $5,400 by end-2027, while also noting that a modest 0.5% diversification of foreign U.S. asset holdings into gold could, in its scenario work, be enough to push the metal toward $6,000.
LBMA analysts are less extreme on average, with a 2026 consensus around $4,269 and a broad range of roughly $3,700 to $5,175. That spread is important because it implies analysts broadly agree gold belongs in a higher regime, but remain divided on how sticky ETF demand and safe-haven psychology will be.
The strongest upside forecasts still come from major-bank notes summarized by Reuters. Goldman Sachs lifted its end-2026 view to $5,400, while BofA outlined a $5,000 2026 target and Deutsche Bank discussed a $6,000 upside scenario. Those are not 2030 forecasts, but they define the slope required for any 2030 bull case above $8,000.
| Source | Published view | Why it matters |
|---|---|---|
| J.P. Morgan Global Research | $5,055 average in Q4 2026 and roughly $5,400 by end-2027 | Official bank research remains constructive despite already-elevated prices. |
| J.P. Morgan scenario analysis | $6,000 if just 0.5% of foreign U.S. asset holdings diversify into gold | Useful as a stress-test for how powerful reserve shifts could become. |
| J.P. Morgan Private Bank | $6,000-$6,300 medium-term outlook | Adds a multi-asset allocation perspective rather than a pure commodities call. |
| LBMA 2026 survey | $4,269 average, with analyst ranges stretching roughly $3,700-$5,175 | Shows consensus still sees a high-price regime but not a one-way market. |
| World Gold Council 2026 outlook | +5%-15% in a softer-growth case; +15%-30% in a deeper risk-off case | WGC frames gold best through scenarios instead of point targets. |
| Goldman Sachs via Reuters | $5,400 by end-2026 | One of the stronger major-bank upside calls tied to ETF and central-bank demand. |
| BofA via Reuters | $5,000 in 2026 | Useful bullish reference, but still below the more aggressive extreme-bull narratives. |
| Deutsche Bank via Reuters | $6,000 bull-case discussion for 2026 | Illustrates how upside scenarios widen when reserve diversification is assumed to accelerate. |
05. Bull, Bear, and Base Case
A credible 2030 forecast needs explicit conditions, probability assumptions, and a clear invalidation framework
Bullish scenario
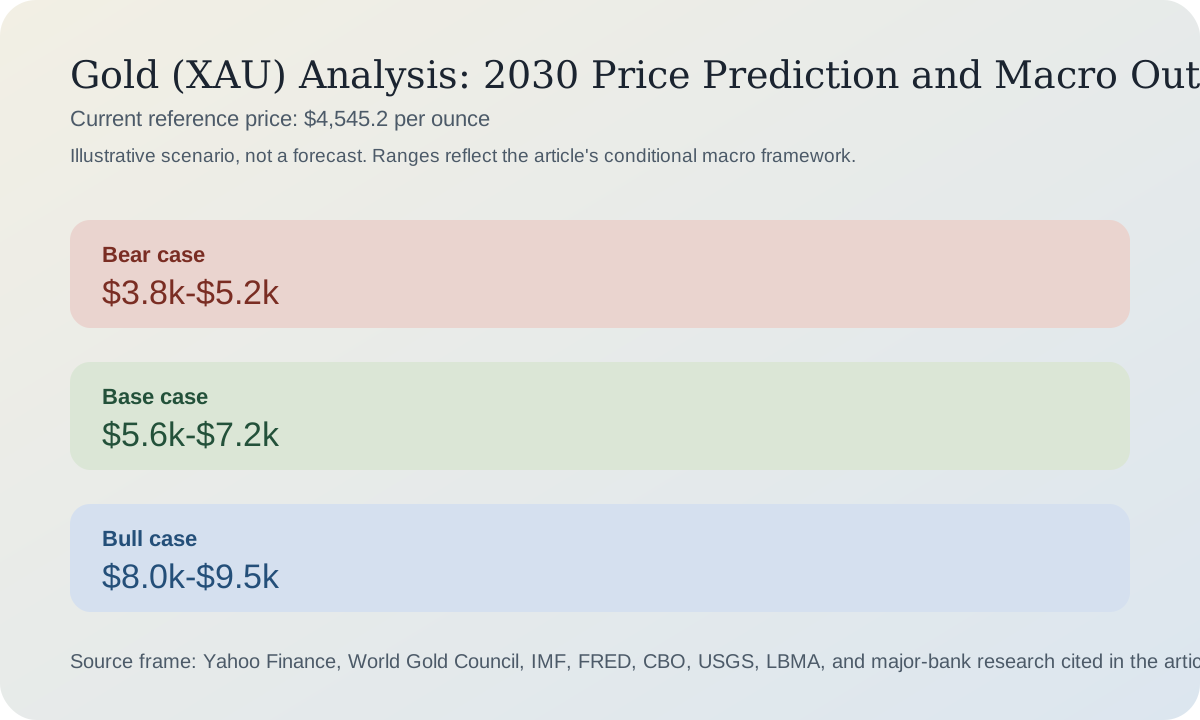
The bull case is $8,000 to $9,500 by 2030. It requires reserve diversification to keep broadening, central banks to stay active near current pace, real yields to trend lower, and ETF ownership to regain momentum. It also assumes fiscal anxiety remains a recurring feature rather than fading as a one-cycle panic.
Base-case scenario
The base case is $5,600 to $7,200. That range assumes central-bank demand remains solid but somewhat price-sensitive, reserve diversification continues gradually, and real yields oscillate instead of collapsing. In practical terms, it implies gold compounds from a higher floor rather than exploding from one macro shock to the next.
Bearish scenario
The bear case is $3,800 to $5,200 by 2030. This would not require the long-term gold thesis to disappear. It would require a stronger dollar, persistently high real yields, softer ETF ownership, and more confidence in U.S. fiscal and monetary stability than the market currently shows.
Risks to watch
The main risks are real-yield persistence, a sharp reversal in ETF demand, unexpectedly strong mine or scrap supply growth, and any evidence that central banks are becoming meaningfully more price-sensitive at these levels.
What could invalidate the forecast
The constructive 2030 base case would be too optimistic if reserve diversification stalls, official buying falls back toward pre-2022 norms, and real yields remain near 2% for several years. It would be too conservative if private and official diversification into gold accelerates simultaneously and macro policy uncertainty deepens.
Conclusion
Gold's 2030 outlook is still better framed as a probability distribution than a single price target. Available data suggests the floor is higher than it was a decade ago, but the evidence is mixed on whether that floor automatically translates into another parabolic leg. Investors should therefore treat $8,000-plus as an extreme bull case, not as the default path.
| Scenario | Illustrative range | Conditions | Probability |
|---|---|---|---|
| Bull | $8,000-$9,500 | Reserve diversification accelerates, official demand stays high, and real yields trend lower. | 25% |
| Base | $5,600-$7,200 | Structural support persists without a dramatic macro regime break. | 50% |
| Bear | $3,800-$5,200 | Real yields and the dollar stay firm, while investor demand cools. | 25% |
| Path | Estimated probability | Comment |
|---|---|---|
| Probability of rising | 55% | The long-run structural case remains stronger than in the 2010s. |
| Probability of falling | 20% | A lower 2030 price would likely need both cyclical and structural disappointment. |
| Probability of moving sideways | 25% | Sideways-but-volatile is plausible if official buying supports the floor while investor conviction fades. |
06. Investor Implications
A 2030 framework is only useful if it changes how different investors manage risk
A serious gold outlook should not end with a price range. It should translate that range into portfolio behavior. For many readers, the most practical distinction is between owning gold as insurance and owning gold as a directional macro trade. The same scenario table can justify very different actions depending on whether a reader is already in profit, under water, or still waiting for an entry.
That is why position sizing, rebalancing, and timing discipline matter as much as the narrative. Gold can still be strategically useful even if it fails to hit the most optimistic target, and it can still hurt a portfolio if the position is too large or entered too aggressively near crowded levels.
| Investor type | Cautious approach | What to watch |
|---|---|---|
| Investor already in profit | Hold a core allocation if the hedge thesis still fits, but trim or rebalance if gold has become oversized. | ETF flows, real yields, and whether gold keeps failing at resistance after macro shocks. |
| Investor currently at a loss | Separate a broken thesis from a bad entry. Average in only if the time horizon is long and the macro case is intact. | Reserve diversification, official buying, and whether corrections remain orderly rather than structural. |
| Investor with no position | Prefer staged entries, wait-for-pullback plans, or dollar-cost averaging over panic buying after spikes. | The relationship between rates, the dollar, and follow-through demand after geopolitical headlines. |
| Trader | Respect volatility, use stop-losses, and trade the macro tape rather than a single long-term narrative. | TIPS yields, the U.S. dollar, ETF flow data, and momentum around prior highs. |
| Long-term investor | Think in terms of portfolio role, rebalance bands, and scenario probabilities instead of one heroic target. | Debt trends, reserve allocations, and whether gold still diversifies stock-and-bond risk. |
| Reader seeking a hedge | Use gold as one hedge among several and avoid assuming it will respond perfectly to every inflation or recession scare. | Correlation with equities and bonds during stress, not just headline inflation. |
Disclaimer: This analysis is for research and informational purposes only. It is not personalized investment advice, and no scenario range should be read as a guaranteed outcome.
07. FAQ
Frequently asked questions about the gold 2030 outlook
Is $8,000 gold realistic by 2030?
It is realistic only as an extreme bull case. It requires lower real yields, strong ETF participation, persistent central-bank buying, and broader reserve diversification to remain aligned for several years.
Why not just use one 2030 target?
Because gold is driven by macro variables that can swing sharply. A scenario range is more honest than pretending there is one precise destination.
What matters most between now and 2030?
Real yields, central-bank demand, reserve diversification, ETF flows, and whether fiscal stress remains a live macro concern.
References
Sources
- Yahoo Finance GC=F recent daily chart
- Yahoo Finance GC=F 10-year monthly chart
- World Gold Council, Gold Demand Trends Q4 and Full Year 2025
- World Gold Council, Full-Year 2025 central banks
- World Gold Council, Full-Year 2025 supply
- World Gold Council, Gold Demand Trends Q1 2026
- World Gold Council, Q1 2026 outlook
- World Gold Council, Q1 2026 technology demand
- World Gold Council, Gold Outlook 2026
- World Gold Council, Why Gold in 2026? A cross-asset perspective
- World Gold Council, Gold Mid-Year Outlook 2025
- World Gold Council, Central Bank Gold Reserves Survey 2025
- IMF COFER Q4 2025 data brief
- FRED 10-year TIPS real yield series
- Congressional Budget Office, Long-Term Budget Outlook
- USGS Mineral Commodity Summaries 2026
- J.P. Morgan Global Research, gold price outlook
- J.P. Morgan Private Bank, Is it a golden era for gold?
- LBMA 2026 precious metals forecast survey
- LBMA 2026 analyst forecasts for gold
- Reuters/Investing.com summary of Goldman Sachs 2026 gold forecast
- Reuters/Investing.com summary of BofA 2026 gold forecast
- Reuters/Investing.com summary of Deutsche Bank gold upside scenario