01. Quick Answer
Copper (HG) Analysis: 2030 Price Prediction and Macro Outlook
The quick answer is constructive but disciplined. Available data suggests copper has entered a structurally higher trading regime, yet the current price already embeds part of the tight-supply story (Yahoo Finance chart API, HG=F recent daily data; World Bank, Commodity Markets Outlook, April 2026; Reuters on Goldman Sachs maintaining a 2026 copper average forecast of $12,650/t). That means the 2030 base case should allow for both elevated prices and recurring corrections.
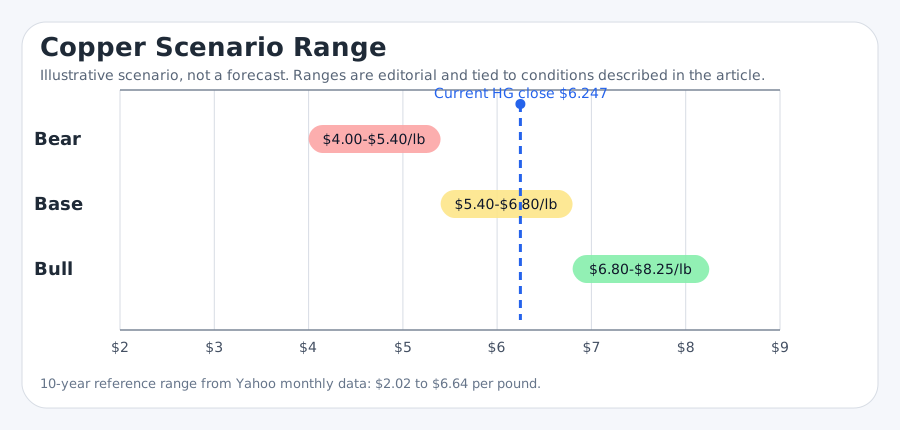
A reasonable 2030 editorial range is $5.40-$6.80/lb for HG. The lower half assumes copper normalizes closer to long-run inducement pricing once new projects, scrap, and slower construction absorb today's shortage premium. The upper half assumes the market keeps paying for scarcity because mine development, grade decline, and grid investment stay out of sync (IEA, Copper report within Global Critical Minerals Outlook 2024; IEA chart, mined supply and demand outlook for copper, 2026-2035; BHP Insights, How copper will shape our future).
| Category | Evidence-based read | Implication |
|---|---|---|
| Historical data | HG moved from a 10-year low near $2.02/lb to a record monthly high near $6.65/lb. | Long-run upside has already repriced part of the scarcity thesis. |
| Current market conditions | Copper is trading above the World Bank's 2026 annual average forecast and near cycle highs. | Near-term optimism is real, but so is pullback risk. |
| Institutional signals | UBS, Goldman, Citi, IEA, ICSG, and BHP all point to a structurally tight market, but not to a straight line higher. | 2030 analysis should be scenario-based, not anchored to one heroic target. |
| Main watchpoints | Mine supply, scrap response, Chinese demand, grid capex, and tariff-driven inventory distortions. | These variables will likely matter more than one-quarter narratives. |
02. Historical Context
Current market snapshot and historical context
Copper's 2030 outlook makes more sense when viewed against a 10-year trading band that ran from roughly $2.0205/lb to $6.6450/lb in monthly Yahoo data. That is a wide range, but it also shows why investors should distinguish between a cyclical correction and a structural regime break (Yahoo Finance chart API, HG=F 10-year monthly data).
| Metric | Latest read | Why it matters |
|---|---|---|
| Spot context | $6.247/lb | Anchors every forward scenario in the current market |
| 10-year low/high | $2.02 / $6.65 per lb | Shows how far the cycle has already repriced |
| World Bank 2026/2027 | $12,000/t then $11,000/t | Suggests official baseline still expects some cooling from present levels |
| ICSG 2026 balance | 96,000 t refined surplus | A reminder that near-term balances can loosen even inside a long-run shortage thesis |
| Period marker | Approximate price | Interpretation |
|---|---|---|
| 10-year low | $2.02/lb | The monthly series bottomed near this level during the 2016 industrial slowdown. |
| 2020 shock reset | around $2.10/lb | Copper sold off during the pandemic shock before reopening demand changed the trend. |
| 2021 reopening high | near $4.89/lb | Electrification optimism and supply friction started to re-rate the metal. |
| 2024–2026 re-rating | $5.20 to $6.64/lb | Tighter supply, tariffs, AI-related power demand, and mine disruptions pushed HG into a higher regime. |
| Latest close | $6.247/lb | Yahoo daily data puts HG near cycle highs on May 18, 2026. |
03. Main Drivers
Main drivers of price movement
1. Supply is improving more slowly than demand is evolving
The IEA's copper work shows 2030 demand in the Announced Pledges Scenario at 31.1 million metric tons and primary supply requirements at 25.2 million metric tons, with a 31% project-pipeline shortfall against 2035 APS mining requirements (IEA, Copper report within Global Critical Minerals Outlook 2024; IEA chart, mined supply and demand outlook for copper, 2026-2035). That is why the market keeps treating mine delays as price-relevant, not just operational noise.
2. Near-term balances can soften without killing the long-term bull thesis
ICSG's April 2026 update shifted the refined market to a projected 96,000-ton surplus in 2026 and 377,000 tons in 2027 because demand growth slowed and secondary output improved (Reuters on ICSG April 2026 forecast update). That matters because 2030 forecasts built only on 'shortage forever' are too loose. Copper can stay structurally attractive while still suffering a surplus year or two.
3. Electrification keeps broadening the demand floor
The IEA, S&P Global, and BHP all converge on one idea: copper demand is no longer tied to one end-market. EVs, renewables, grids, and digital infrastructure now compete for the same metal (IEA, Global Critical Minerals Outlook 2025 overview; S&P Global, Plugged in and politicized: Copper in a fractured world; BHP, Copper Growth). That lowers the odds of a full demand collapse unless global growth itself breaks sharply.
4. China's role is still decisive, but no longer exclusive
Goldman cited resilient Chinese copper demand and strong exports when it upgraded short-term price expectations in 2025 (Reuters on Goldman Sachs raising short-term copper forecasts on resilient Chinese demand). Still, the evidence is mixed on how durable that support will be if property remains weak and export momentum fades.
5. Policy and trade frictions can distort the tape
Recent U.S. trade measures and copper's addition to the U.S. critical-minerals list reinforce that copper is becoming a strategic material as much as a commodity (U.S. Department of the Interior, final 2025 List of Critical Minerals; World Bank, Commodity Markets Outlook, April 2026). That can tighten regional markets even when the global balance looks less alarming on paper.
04. Institutional Forecasts and Analyst Views
Institutional forecasts and analyst views
Institutional forecasts do not point to one neat 2030 number. They point to a market where the short-term average can cool while the long-run scarcity signal remains intact. That is why a scenario range is more defensible than a single-point estimate (World Bank, Commodity Markets Outlook, April 2026; UBS CIO, commodities note, February 27, 2026; Reuters on Goldman Sachs reiterating a $15,000/t copper view for 2035).
| Source | Forecast / signal | Interpretation |
|---|---|---|
| World Bank | $12,000/t in 2026 and $11,000/t in 2027 | Official baseline sees prices staying high but cooling from recent spikes |
| ICSG | Small refined surplus in 2026 | Near-term balances can loosen if scrap and secondary supply rise |
| UBS | $14,500/t year-end 2026; $15,000/t by end-March 2027 | A deficit-heavy institutional bull view |
| Goldman Sachs | $12,650/t average in 2026; $15,000/t in 2035 | Tight near-term market, stronger long-run scarcity thesis |
| Citi | Around $13,000/t with a base case near $12,000/t by Q4 2026 | Constructive, but not assuming a one-way surge |
| BHP / IEA / S&P Global | No single price target, but persistent supply stress into the 2030s | Structural rather than tactical signposts |
05. Bull, Bear, and Base Case
How the forecast range and probability table are built
The range in this article is editorial and scenario-based rather than a deterministic forecast. It starts with current HG pricing, the 10-year trading band, the World Bank near-term baseline, ICSG balance data, and structural demand evidence from IEA, S&P Global, and BHP.
| Scenario | Price range | Conditions | Probability |
|---|---|---|---|
| Bull | $6.80-$8.25/lb | Mine delays persist, electrification and AI load surprise higher, and real yields stay supportive for hard assets | 30% |
| Base | $5.40-$6.80/lb | The market oscillates between structural tightness and periodic surplus, with prices anchored by high inducement costs | 45% |
| Bear | $4.00-$5.40/lb | China weakens more than expected, scrap response improves, and new supply plus slower growth deflate the scarcity premium | 25% |
| Direction | Probability | Comment |
|---|---|---|
| Higher by 2030 | 40% | Still the single most plausible direction if the energy-transition and grid thesis holds |
| Lower by 2030 | 25% | Requires softer Chinese demand and better-than-expected supply delivery |
| Sideways but volatile | 35% | A realistic outcome if copper stays expensive but repeatedly mean-reverts toward marginal cost |
| Investor type | Prudent approach | Main watchpoints |
|---|---|---|
| Investor already in profit | Hold a core position but trim into euphoric squeezes rather than assume every spike is permanent. | Watch Chinese demand, LME inventories, and project approvals. |
| Investor currently at a loss | Reassess whether the position size fits a volatile commodity and avoid averaging mechanically. | Separate the long-run thesis from entry-price regret. |
| Investor with no position | Wait for pullbacks or use staged entries instead of chasing near-record HG prints. | The base case is constructive, but timing risk is real. |
| Trader | Use stop-loss discipline and focus on spreads, inventories, macro headlines, and tariff-driven basis moves. | HG can overshoot fundamentals in both directions. |
| Long-term investor | Dollar-cost averaging can make sense only if you accept multi-quarter drawdowns inside a structural bull market. | Tie position sizing to a 2030 thesis, not a 2-week tape. |
| Risk-hedging investor | Use copper selectively as an inflation and infrastructure hedge, but rebalance if it becomes an oversized cyclical bet. | Copper hedges some macro risks while adding others. |
Copper's 2030 outlook remains constructive because the long-run supply response still looks slower than the combined pull from grids, transport electrification, and digital infrastructure. But the evidence is mixed on whether today's HG price already discounts too much of that story. The base case therefore favors structurally high prices with repeated corrections, not an uninterrupted melt-up. Disclaimer: This article is for informational and research purposes only and does not constitute personalized financial advice.
06. FAQ
Frequently asked questions
What is the most defensible copper price outlook for 2030?
A range is more defensible than a point target. The editorial base case here is $5.40-$6.80/lb because current prices are already high, but the structural supply story remains unresolved.
Why not just use the World Bank forecast?
The World Bank baseline is valuable for the next one to two years, but a 2030 outlook also has to account for mine depletion, scrap trends, and electrification scenarios.
What could push copper below $5/lb again?
A sharper China slowdown, a bigger-than-expected refined surplus, better scrap supply, or a broad macro recession could all do it.
What would invalidate the constructive 2030 view?
Evidence that new supply arrives faster than expected, or that demand from electrification and AI is overstated, would weaken the constructive case materially.
Methodology and Invalidation
How to interpret this framework and what would change it
This 2030 range combines current HG pricing, the May 2016 to May 2026 monthly trading band, official near-term price baselines from the World Bank, refined-balance guidance from ICSG, and longer-horizon supply-demand evidence from IEA, S&P Global, and BHP (Yahoo Finance chart API, HG=F 10-year monthly data; World Bank, Commodity Markets Outlook, April 2026; Reuters on ICSG April 2026 forecast update; IEA, Copper report within Global Critical Minerals Outlook 2024; S&P Global, Plugged in and politicized: Copper in a fractured world; BHP, Copper Growth). The point is not to pretend precision. The point is to identify which assumptions are doing the heavy lifting.
The probability table leans on three questions. First, is the current price mostly a temporary squeeze or a sustainable regime shift? Second, how much of the 2030 tightness thesis can scrap, substitution, and brownfield expansions absorb? Third, does macro growth stay strong enough for electrification demand to matter more than construction weakness? Those inputs are judgment-based, but they are anchored to cited evidence instead of a narrative-only forecast.
What would invalidate the base case? A persistent refined surplus, faster commissioning of major mines, or unmistakably weaker demand in China and global manufacturing would all argue for lower ranges. What would invalidate the bear case? If project delays continue while AI power build-outs and grid spending stay firm, the bear range would prove too conservative. Investors should update the framework when the balance evidence changes, not when the headline mood changes.
References
Sources
- Yahoo Finance chart API, HG=F 10-year monthly data
- Yahoo Finance chart API, HG=F recent daily data
- World Bank, Commodity Markets Outlook, April 2026
- ICSG, Table 1: World refined copper production and usage trends, April 2026
- Reuters on ICSG April 2026 forecast update
- IEA, Copper report within Global Critical Minerals Outlook 2024
- IEA, Global Critical Minerals Outlook 2025 overview
- IEA chart, mined supply and demand outlook for copper, 2026-2035
- S&P Global, Copper in the Age of AI: Challenges of Electrification, January 2026
- S&P Global, Plugged in and politicized: Copper in a fractured world
- BHP, Copper Growth
- BHP Insights, How copper will shape our future
- IMF, World Economic Outlook, April 2026
- USGS, Mineral Commodity Summaries 2026
- UBS CIO, commodities note, February 27, 2026
- Reuters on Goldman Sachs reiterating a $15,000/t copper view for 2035
- Reuters on Goldman Sachs maintaining a 2026 copper average forecast of $12,650/t
- Reuters on Goldman Sachs raising short-term copper forecasts on resilient Chinese demand
- Reuters on Citi's copper base case near $12,000/t by Q4 2026
- U.S. Department of the Interior, final 2025 List of Critical Minerals