01. Current Setup
Why the 2027 AXA forecast is a catalyst question
The 2027 call for AXA is less about distant theory and more about visible catalysts. Investors already know AXA is profitable, diversified, and generous with capital returns. What they need to decide now is whether the next 12 to 18 months will bring enough incremental evidence on earnings growth, solvency durability, strategic-plan continuity, and buyback credibility to push CS higher from here.
| Catalyst | Why it matters |
|---|---|
| 2026 earnings delivery | Near-term price action still depends on whether AXA finishes the current plan at the top end of guidance. |
| September 2026 strategic plan | The market needs confidence that post-2026 growth is not fading. |
| Capital return credibility | Dividend and buyback support are core to the shareholder case. |
| Cat-loss and reserve experience | A dividend-rich insurer can still derate if claims confidence weakens. |
Recent trading shows why 2027 should be framed as a catalyst forecast. CS.PA traded above EUR 42 in 2025, then slipped back toward EUR 39.18 in May 2026 as the market digested ex-dividend effects, macro volatility, and the fact that even good insurers rarely move in straight lines (recent Yahoo Finance pricing). The stock is not broken. It is simply asking investors for fresh reasons to move higher.
| Metric | Latest reading | 2027 implication |
|---|---|---|
| 1Q26 gross written premiums and other revenues | EUR 38.0 billion, up 6% | Supports the idea that the current plan remains on track. |
| 1Q26 P&C premiums | EUR 21.5 billion, up 4% | Commercial and retail P&C still provide a stable engine. |
| 1Q26 Life & Health premiums | EUR 16.5 billion, up 8% | Shows healthy momentum in businesses management wants to scale. |
| 1Q26 Solvency II ratio | 211% | Keeps capital return and resilience debates constructive. |
| 2026 UEPS guidance | Upper end of 6-8% plan target range | A strong near-term anchor for the equity story. |
The evidence is mixed only in the sense that AXA already looks obviously good on many public metrics. That raises the hurdle for a further rerating. The next move up probably requires new proof points rather than recycled admiration for past execution.
In practical terms, 2027 is where AXA must show that the current plan was not the easy part and that the next plan can keep the same earnings quality without stretching for growth.
That makes the setup unusually sensitive to messaging. A merely acceptable strategic update may not be enough, because investors already know AXA can produce solid numbers. What they want is evidence that earnings quality, reserve discipline, and capital return can remain mutually supportive beyond the current plan window.
Another nuance is that near-term upside may depend less on top-line excitement than on the absence of unpleasant surprises. For mature insurers, a quiet quarter with strong solvency and clean reserve language can sometimes do more for the share price than a louder revenue beat.
02. Catalysts
Five developments that can move CS over the next 12 to 18 months
1. Delivery against 2026 guidance
If AXA truly lands at the upper end of the 6% to 8% underlying EPS plan target, the market is more likely to reward the stock with confidence heading into 2027 (Q1 2026 guidance). If that guidance slips, the shares may stall even if absolute profitability remains high.
2. The September 2026 strategic plan
This is probably the most obvious named catalyst. Investors need a convincing bridge from the 2024-2026 plan into the 2027-2029 cycle. If management can show the same mix of discipline, cash generation, and line-of-business quality, CS can regain momentum.
3. Capital return execution
AXA's dividend and buyback posture is not cosmetic. It is part of why many shareholders own the stock in the first place. Any change in tone here can alter the near-term range quickly (2026 dividend approval; share buyback execution).
4. Cat losses and reserve confidence
Insurance stocks can remain cheap if investors suspect reported strength is not fully durable. Reserve commentary and catastrophe absorption therefore matter more than generic revenue growth.
5. Industry conditions remain supportive, but selective
Aon's latest market overview shows plenty of capacity and competitive conditions in many lines, while still warning that risk quality and geography increasingly drive outcomes (Aon Q1 2026 overview). That supports AXA if it executes well, but not if it drifts.
03. Institutional View
How guidance and sector conditions frame the 2027 range
Institutional views on AXA's near-term direction are best inferred from current guidance, plan targets, and the insurance-market backdrop. AXA remains on track for the top end of its plan range for 2026 and enters the next strategy reset with a strong solvency ratio. That combination creates a respectable launchpad for 2027.
| Input | Signal | Why it matters |
|---|---|---|
| FY 2025 results | Record underlying performance | Provides a strong earnings base entering 2026. |
| Q1 2026 indicators | Growth and solvency remain solid | Supports confidence that AXA is not losing momentum. |
| Current strategic plan | Targets already look largely credible | The market now needs the next set of targets. |
| Swiss Re and Deloitte | The sector remains attractive but risk-heavy | Helps explain why AXA can rerate, but not ignore volatility. |
Available data suggests analysts remain divided less on AXA's quality than on upside magnitude from current levels. That is typical for mature insurers. The company does not need to prove it is viable; it needs to prove there is another leg of compounding left for the share price.
That is why the 2027 setup is catalyst-driven. Better-than-expected plan continuity, ongoing solvency strength, and another year of clean capital return could all matter more than any one-quarter revenue figure in isolation.
Put differently, the market is likely to reward confirmation that AXA can remain boring in the profitable sense. If management can make investors feel that the next two years look predictable for the right reasons, the stock may not need spectacular growth to re-rate modestly higher.
04. Scenarios
Bull, base, and bear cases for AXA in 2027
Bullish scenario
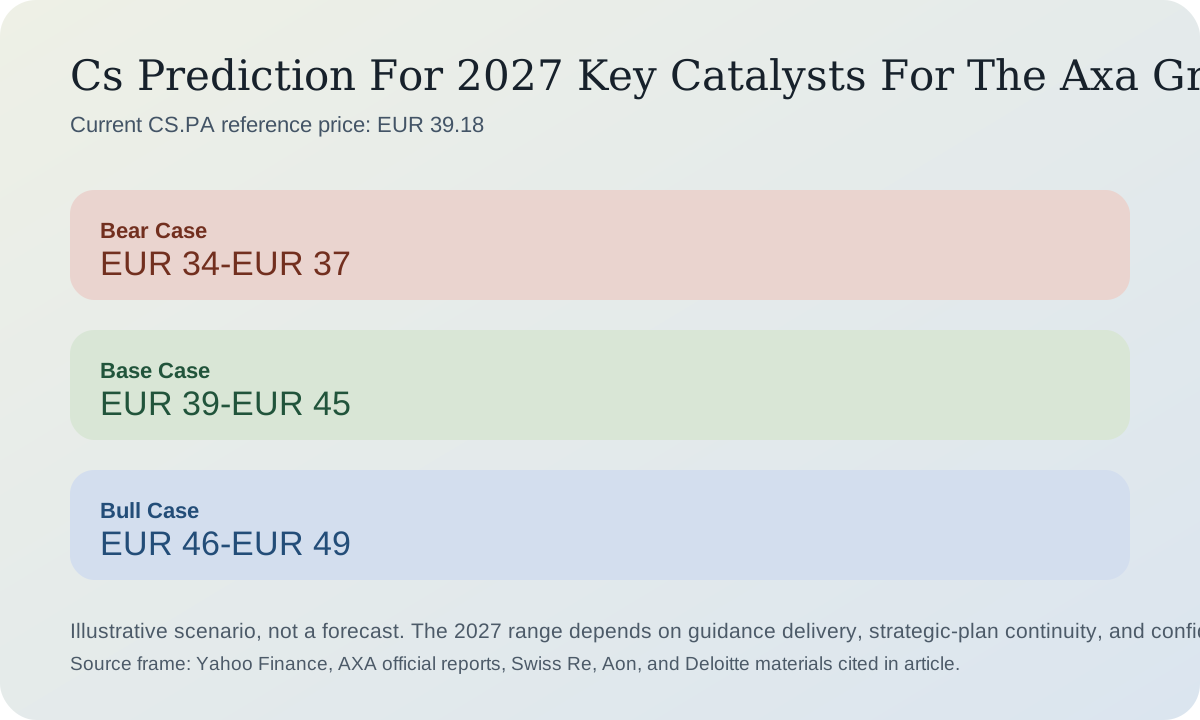
The bull range is EUR 46 to EUR 49. That would likely require AXA to finish 2026 strongly, launch a credible new plan, keep solvency comfortably above market comfort levels, and reassure investors that dividends and buybacks can continue without compromising growth.
Bearish scenario
The bear range is EUR 34 to EUR 37. That would fit a scenario where reserve quality is questioned, catastrophe losses are heavier than expected, or the post-2026 plan looks less compelling than the one the market has already rewarded.
Base-case scenario
The base case is EUR 39 to EUR 45. That assumes AXA keeps executing well but remains valued like a strong insurer rather than a narrative stock.
| Path | Probability | Reasoning |
|---|---|---|
| Rising in 2027 | 46% | Supported by current guidance and strong starting fundamentals. |
| Moving sideways | 32% | Possible if AXA performs well but the market waits for stronger rerating evidence. |
| Falling | 22% | Would likely require either execution disappointment or a change in confidence around capital returns. |
| Investor type | Prudent approach | Catalyst to monitor |
|---|---|---|
| Investor already in profit | Hold or trim into strength if position sizing is stretched. | September 2026 strategic-plan reception. |
| Investor currently at a loss | Do not average blindly; wait for evidence that the plan reset is working. | Solvency trend and payout language. |
| Investor with no position | Prefer staged entry or a pullback rather than chasing a defensive rally. | Results quality more than top-line growth. |
| Trader | Use stops and respect ex-dividend effects and earnings volatility. | Results dates and macro financials sentiment. |
| Long-term investor | Focus on whether 2027 improves the durability of the compounding story. | Continuation of capital return plus growth. |
| Risk-hedging investor | Treat AXA as a quality financial, not a direct crisis hedge. | Credit spreads and cat-loss season. |
How this range was built: it blends the current share price, the 2025-2026 earnings and solvency picture, the likelihood of a supportive strategy update, and the historical tendency for AXA to move in measured rather than explosive steps.
Risks to watch: reserve concerns, cat losses, weaker plan targets, lower buyback confidence, or a softer pricing backdrop in key insurance lines.
What would invalidate this forecast: an unexpectedly aggressive strategic pivot, an outsized balance-sheet event, or a much stronger earnings acceleration than current guidance implies.
Disclaimer: This article is for informational purposes only and does not constitute individualized financial advice. Near-term scenarios are conditional and not guaranteed.
For 2027, AXA looks more like a high-quality execution story than a broken or euphoric one. That usually rewards patience and selectivity more than impulsive chasing.
The practical lesson is that investors should watch the sequence of catalysts, not just the headline outcome. Strong earnings, steady solvency, and a disciplined next plan arriving in the right order can change sentiment quickly. Weak messaging on any of those points can keep the stock trapped even if the franchise remains fundamentally solid.
05. FAQ
Frequently asked questions about AXA's 2027 outlook
What is the single biggest 2027 catalyst for AXA?
The new strategic plan expected in September 2026 is probably the clearest identifiable catalyst.
Why has CS pulled back from the highs?
Part of the move reflects normal re-pricing after a strong run, along with ex-dividend effects and broader market caution toward financials.
Does a strong dividend make 2027 downside unlikely?
No. A strong dividend can support sentiment, but it does not remove reserve, catastrophe, or execution risk.
Could AXA make a new high in 2027?
Yes, but the base case still assumes a more measured move rather than a runaway breakout.
06. Sources
Reference list
- Yahoo Finance chart API for CS.PA, 10-year monthly history
- Yahoo Finance chart API for CS.PA, recent daily closes
- AXA Full Year 2025 earnings release
- AXA 1Q26 activity indicators
- AXA 2025 Annual Report
- AXA 2024-2026 strategic plan and financial targets
- AXA strategic plan page
- AXA 2026 share buyback execution release
- AXA 2026 shareholders meeting and dividend approval
- AXA analysts coverage page
- AXA ratings page
- Swiss Re sigma 2/2025 on world insurance conditions
- Swiss Re sigma 5/2025 on insurance market outlook
- Aon Q1 2026 global insurance market overview
- Deloitte 2026 global insurance outlook